10 Tricks for creating advanced interactive Stock Charts with Bokeh (Python Tutorial)
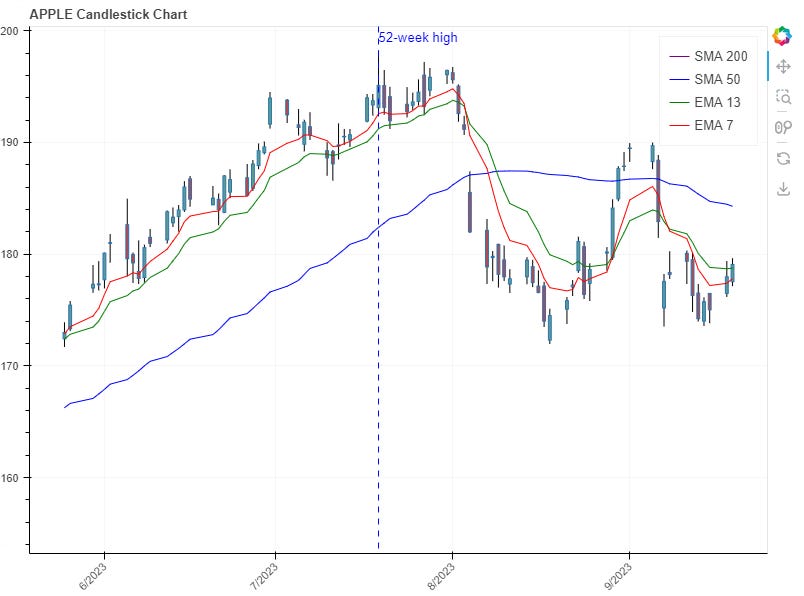
In this post I wanted to showcase 10 tips and tricks for creating advanced, interactive stock charts using the Python visualization library ‘Bokeh’.
This story is solely for general information purposes, and should not be relied upon for trading recommendations or financial advice. Source code and information is provided for educational purposes only, and should not be relied upon to make an investment decision. Please review my full cautionary guidance before continuing.
What is Bokeh?
Bokeh is a visualization library for Python that lets one create complex interactive charts and dashboards. This popular library has 17.1 stars on Github and a very active user community.
Bokeh has several advanced features some of which surpass the capabilities of the trusted matplotlib or Plotly libs I usually use for charting.
Here the main features of Bokeh:
Interactive:
Bokeh is designed to produce elegant and interactive visualizations with high-performance interactivity over large or streaming datasets.
Ease of Use:
Bokeh provides an easy-to-use interface for creating complex visualizations, including methods to build plots layer by layer in a manner similar to Matplotlib, but with the advantage of interactivity.
JavaScript Integration:
Underneath, Bokeh translates Python constructs into JavaScript, allowing for rendering in modern web browsers.
Versatile in Deployment:
Bokeh visualizations can be embedded into Python-based web applications, especially those using Flask and Django. They can also be viewed in Jupyter notebooks, standalone HTML files, or server-backed applications using Bokeh Server.
Built-in Widgets:
Bokeh includes support for various widgets like sliders, dropdown menus, and buttons, facilitating the creation of interactive dashboards.
Flexible Styling:
The appearance of Bokeh plots can be finely tuned using its theming capabilities, allowing users to set the visual properties of plots, widgets, and layouts.
Streaming Data:
Bokeh is adept at handling streaming data, which makes it suitable for creating real-time data visualizations.


