
Anatomy of a Market Correction (Python)
Anatomy of a Market Correction (Python)


Data sourced with Yahoo! Finance
On April 10th, 2024 the Dow dropped over 400 points, the S&P 500 fell 1.1% and the NASDAQ 100 fell 0.8%. So what exactly happens during a day like that - like on a minute by minute basis? That’s what I was curious to find out.
In this tutorial we are going to create a Python script that generates a heatmap of stock price changes on a 15-minute intervals using S&P 500 components in order to get a better understanding what happens during that volatile trading day.
This story is solely for general information purposes, and should not be relied upon for trading recommendations or financial advice. Source code and information is provided for educational purposes only, and should not be relied upon to make an investment decision. Please review my full cautionary guidance before continuing.
The Background
What exactly caused the major US market indexes to drop on April 10th, 2024? The trigger was a published report by the US Department of Labor that indicated that the Consumer Price Index (CPI) had picked up again in March 2024.
The report stated:
“Over the last 12 months, the all items index increased 3.5 percent before seasonal adjustment.”
The CPI had been in a continuous decline after the pandemic price surge as you can see in the chart below.
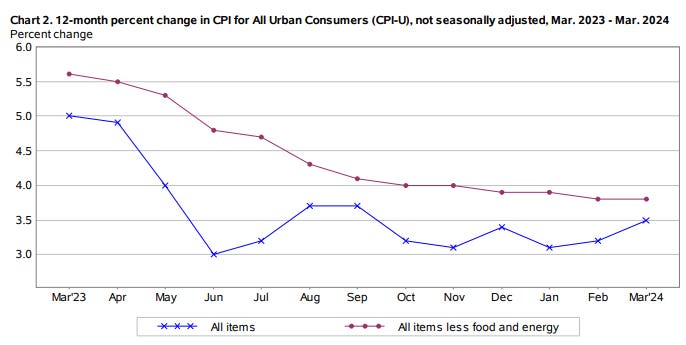
Source: CPI report by published report by the US Department of Labor
An increase in the CPI set’s off a complex market dynamic that needs to be discussed. The CPI spike may signal an uptick inflation, which in turn may motivate the Federal Reserve (Fed) to raise interest rates. The higher interest rates in turn increases the rates at which banks and other financial institution can borrow money, which in theory increases the cost of borrowing for the consumer and thus decreases spending.
An increase of interest rates by the Fed also increases borrowing costs for company’s which in turn can impact company spending, which then may lead to reduced earnings in the future. As a consequence of a more pessimistic earning outlook, investors and traders may reevaluate their portfolios fearing stock price decreases looming on the horizon.
So when exactly was the CPI data released? All CPI data is released before market open on 8:30AM EST.
This explains the backdrop for the market correction this day. In the next sections below we are going to create a visualization that let’s us analyze how the CPI increase affected the stock market.