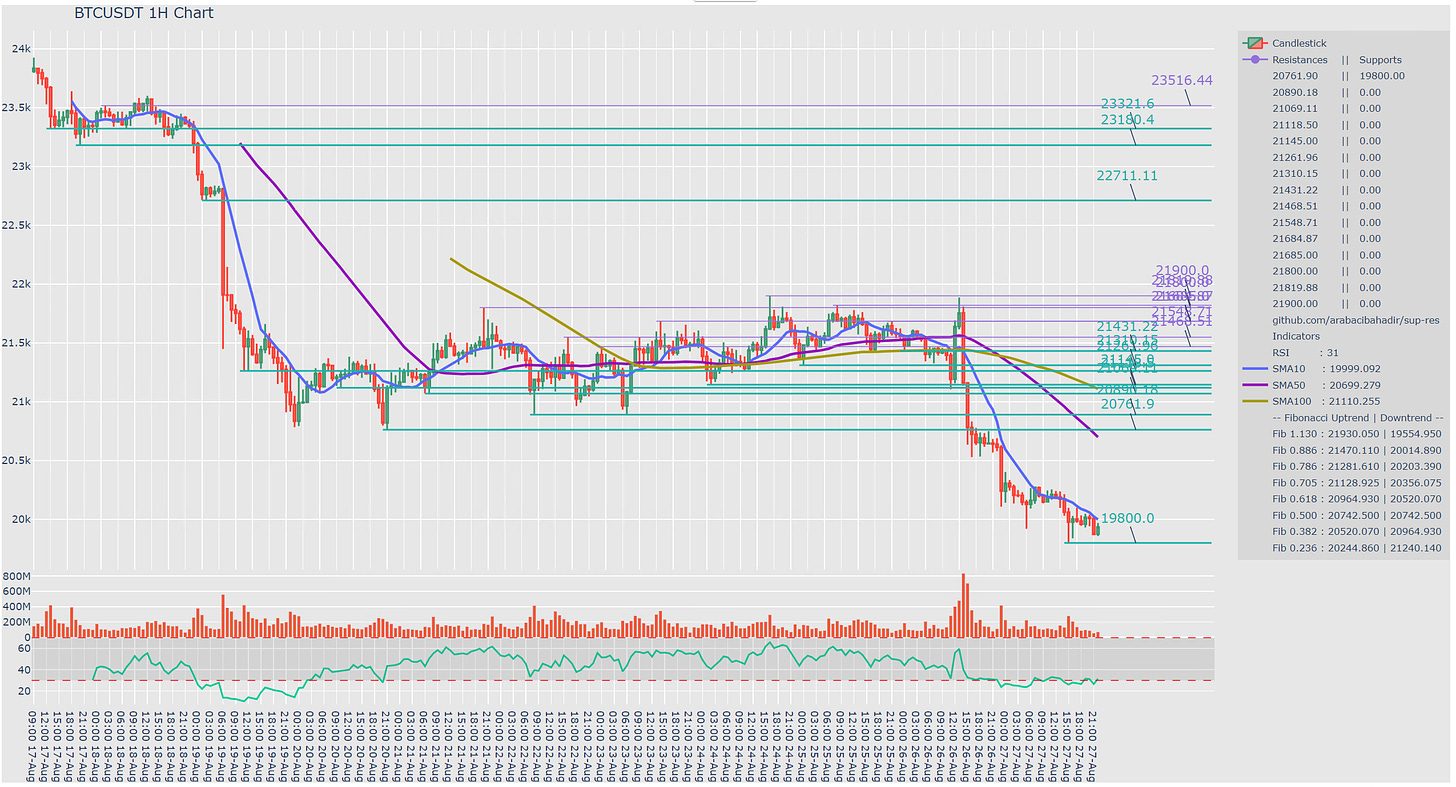
Create awesome, interactive Support/Resistance Charts for Crypto
Sometimes you find some real gems on GitHub.com - you just have to deep dig enough. There’s everything the trading heart desires: bots, trading systems, technical indicator libs, machine learning templates for price predictions, tutorials and a whole lot more.
This story is solely for general information purposes, and should not be relied upon for trading recommendations or financial advice. Source code and information is provided for educational purposes only, and should not be relied upon to make an investment decision. Please review my full cautionary guidance before continuing.
Recently I found a Python script called ‘sup-res’ by arabacibahadir that creates eye-popping interactive support/resistance charts for crypto coins in HTML format. The script can also generate JPEG and PineScript, which can be used to view the chart on tradingview.com.
The best thing about sup-res is that it only takes a minute to set up.
Here an online demo of the interactive sup-res chart for BTCUSDT with a 1 day time period.
What are Support and Resistance Levels?
Support and Resistance Levels are widely used price analysis methods to determine price boundaries.
These levels indicate time periods in which the price rests and eventually breaks out and can be used to determine the timing and direction of a trend.
Documentation for sup-res
You can find the project on Github.com using this link.
Here the link for the sup-res documentation.
Here an online demo of the interactive sup-res chart.
What information does the sup-res chart contain?
The sup-res script creates a candlestick chart of the selected crypto coin with the following features:
Support / Resistance levels
SMA 10, 50, 100
Volume histogram
RSI
Fibonacci Uptrend/ Downtrend.
Which output formats does sup-res generate?
The sup-res script generates the following output formats:
Interactive HTML loaded into browser
HTML file
JPEG
PineScript for use in tradingview.com.


