Detecting and Visualizing Candlestick Patterns (Python Tutorial)
This post is a tutorial on how to detect and visualize candlestick patterns in Python.
This story is solely for general information purposes, and should not be relied upon for trading recommendations or financial advice. Source code and information is provided for educational purposes only, and should not be relied upon to make an investment decision. Please review my full cautionary guidance before continuing.
What are Candlestick Patterns?
Candlestick patterns are graphical formations that traders use to identify potential trading opportunities. Each candlestick pattern has a specific meaning, which may be used to predict the future price action of a security.
Candlestick patterns are formed by the movement of the candlesticks on a chart. Candlesticks are graphical representations of the opening, high, low, and closing prices of a security over a given time period. The body of the candlestick is the area between the open and close prices, and the wick is the line above and below the body.
Candlestick patterns are a valuable tool for stock market investors. By learning to recognize the different patterns, investors can gain a better understanding of the market and be better prepared to make investment decisions.
StockDads.com is a thriving trading community with AI trading stock/crypto alerts, expert advice and a ton of educational materials. Get a 30% forever discount with code ‘BOTRADING’.
What are the common Candlestick Patterns?
There are many different candlestick patterns, but some of the most common include the bullish and bearish engulfing patterns, the hammer and hanging man, three white soldiers or three black crows.
The Hammer
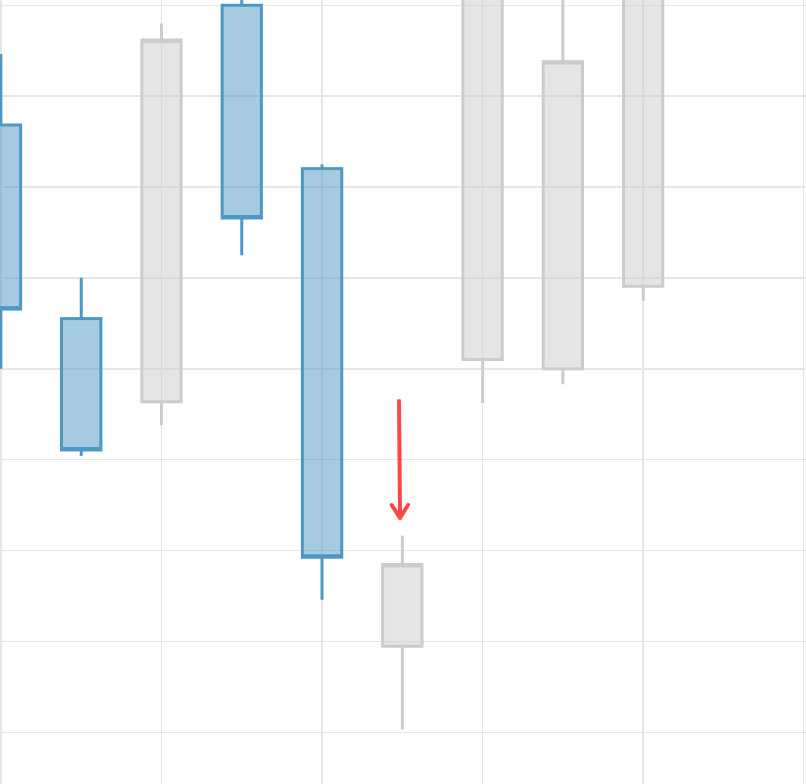
The hammer is a bullish reversal pattern that forms when a black candlestick is followed by a white candlestick the shape of a hammer. The body of the candle is short with a long lower wick.
This pattern is a a sign of the bears driving the prices lower during the bar period but the bulls fighting back and pushing the price back up.
The Doji
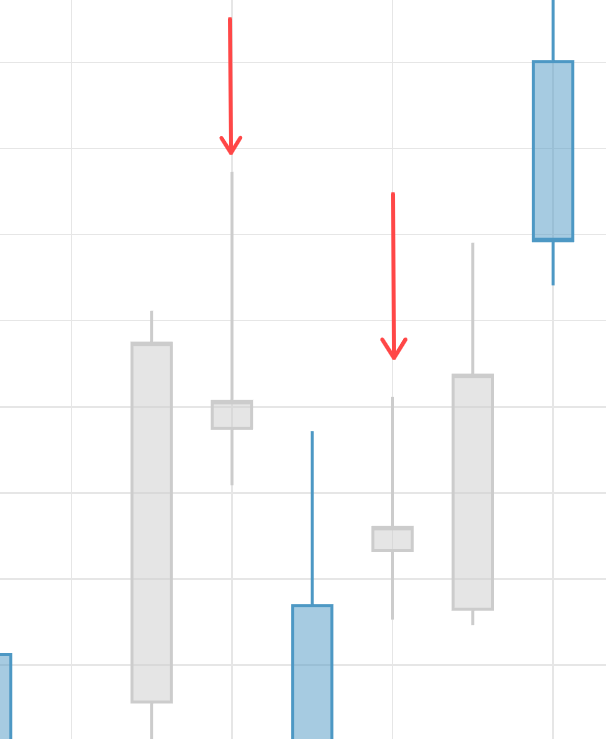
The Doji is a candlestick with a body that is either extremely small or nonexistent. It is formed when the open and close prices are the same, or very close to each other. The Doji pattern may be considered a sign of trend reversal or indecision with the open price being very close or the same as the closing price of the session.
The Hanging Man
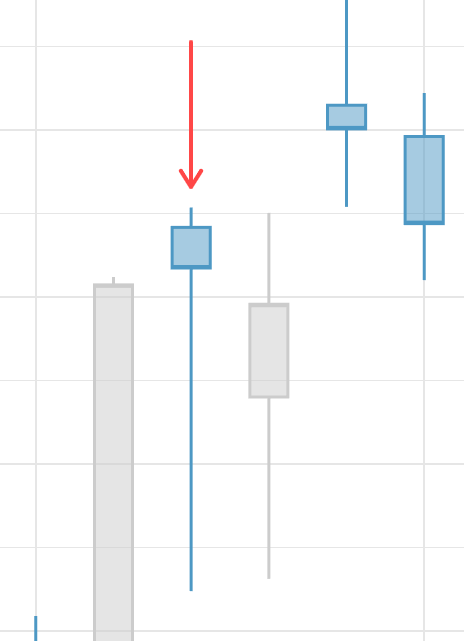
The hanging man is a bearish reversal pattern. It is formed when the security opens higher than the previous close, but sells off to close lower than the open. The hanging man indicates that the security has found resistance and is likely to move lower.
The hanging man candle can be dark or light. It looks similar to the hammer but there is a distinction in how they appear in the trend. A hanging man pattern emerges in a rising trend and indicates a bearish reversal, whereas a hammer emerges in a falling tend and indicates a bullish reversal.
The Bullish/Bearish Engulfing Pattern
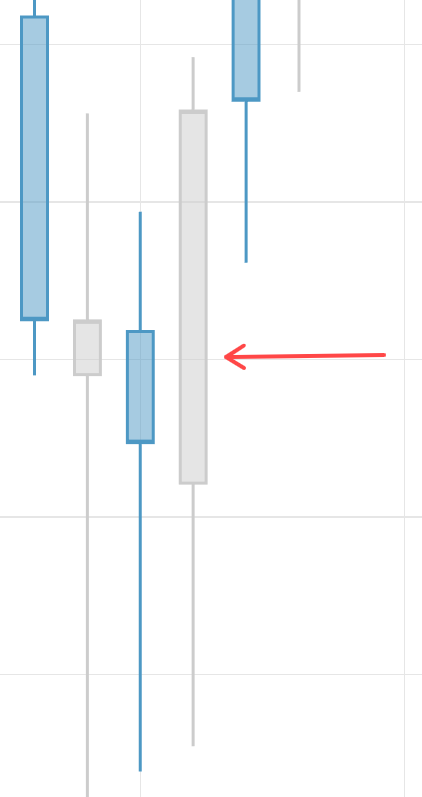
The engulfing pattern is a bullish or bearish pattern that indicates a change in trend. It is formed when the body of one candlestick completely engulfs the body of the previous candlestick.
Here a sample of a bullish engulfing pattern:
Three White Soldiers
The three white soldiers is a bullish reversal pattern. The pattern consists of three consecutive bullish candles, each one closing higher than the prior candle.
Three Black Crows
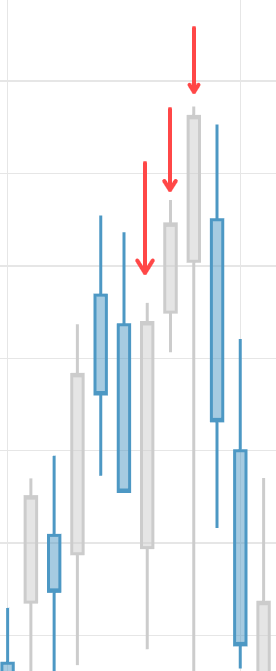
The three black crows is a bearish reversal pattern. It is formed when the there are three bearish candles, each one closing lower than the prior candle.
Which Patterns are most reliable?
Unfortunately, there is no candlestick pattern that is a 100% accurate indicator of the price direction in the future. However, there is a lot of information available regarding the statistical accuracy of candlestick patterns and related pattern rankings.
The ‘PatternSite.com’, is a website created by Tom Bulowski, the author of the Encyclopedia of Chart Patterns, and it provides pattern rankings of past decades as well as rankings for the last three months.
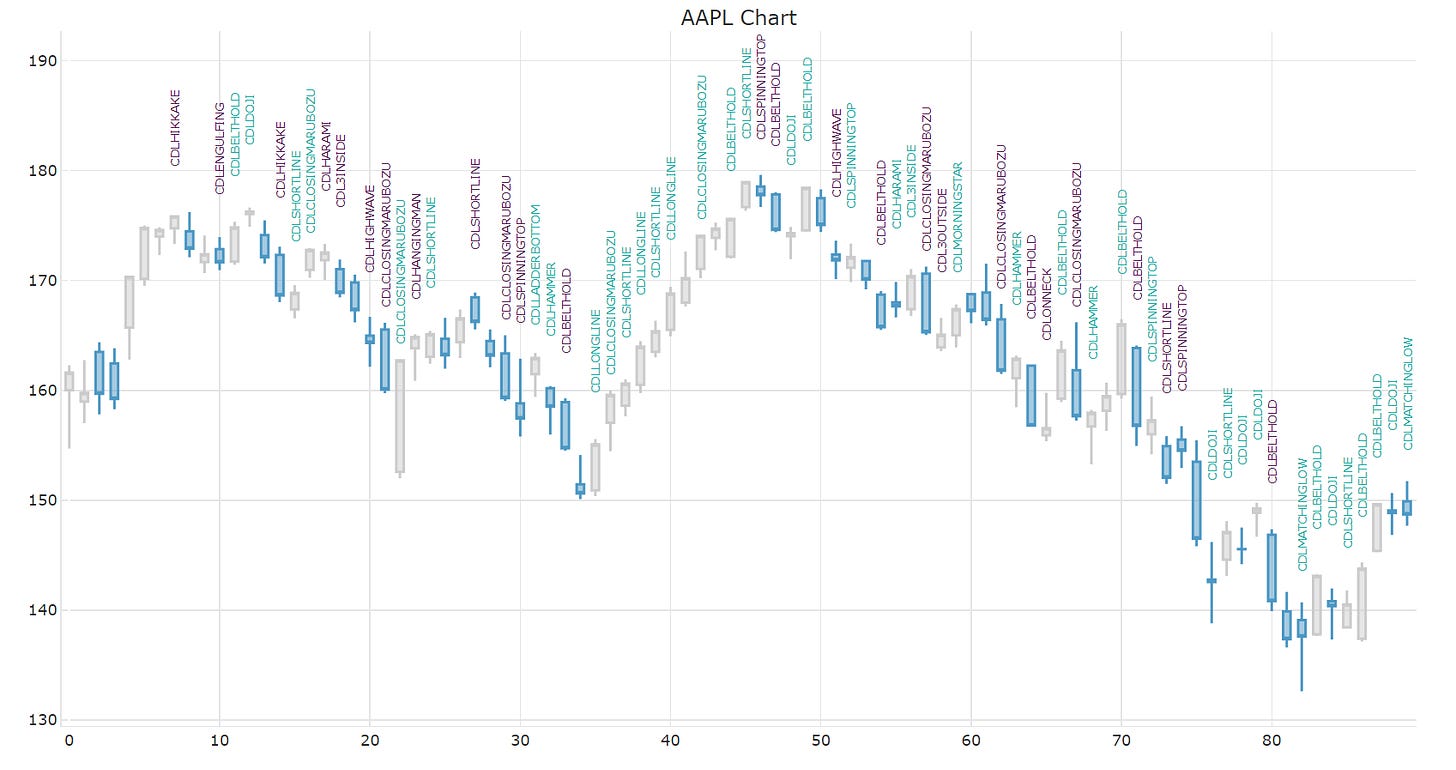
Next, let’s see how we can implement candlestick charts and patterns in Python.


