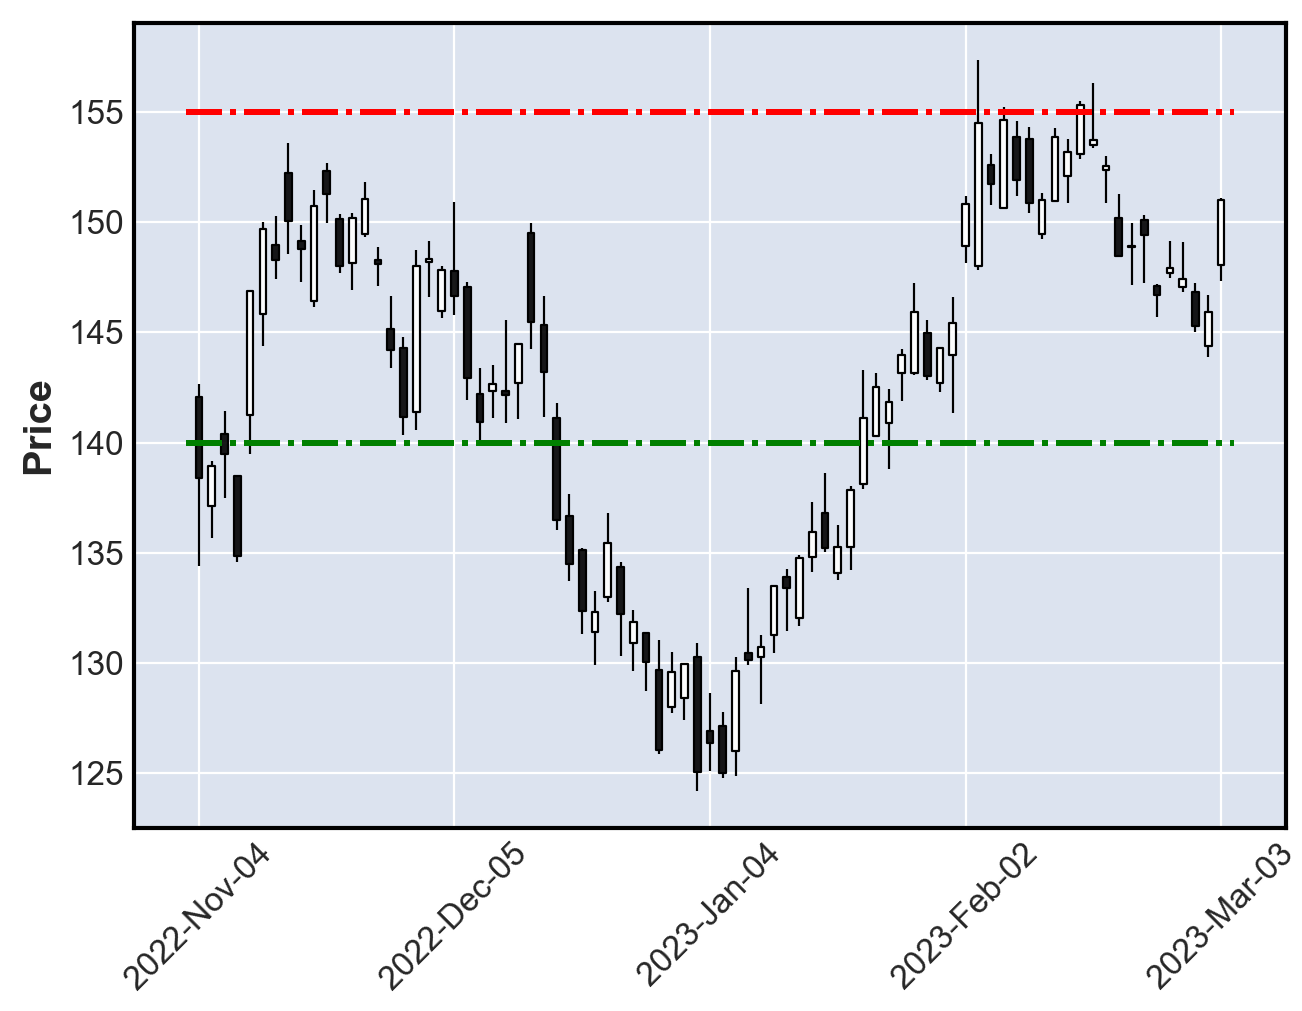
Discover the awesome Power of mplfinance (Python Tutorial)
Chart created with Tiingo API and mplfinance
If you haven’t heard of mplfinance, you’ve been living under a rock. This little Python library that uses matplotlib under the hood offers a whole lot of convenient charting awesomeness and - I mean - it packs a punch! For an overview of what mplfinance can do, often in a single line of code, read on.
This story is solely for general information purposes, and should not be relied upon for trading recommendations or financial advice. Source code has not been tested and should not be used for live trading. Please review my full cautionary guidance before continuing.
What is mplfinance?
mplfinance is a financial charting library for Python developed by the matplotlib development team and designed to make financial charting of pandas dataframes simpler.
In particular, the library offers:
Simplified styling of plots
Simply vertical & horizontal lines, trend lines
Simple sub plots
Fill between lines
Chart types like Candle, Renko or Point-and-Figure charts and
Coloring individual candle sticks
In this tutorial we will introduce the main features mplfinance.
Useful links:
StockDads.com is a thriving trading community with AI trading stock/crypto alerts, expert advice and a ton of educational materials. Get a 30% forever discount with code ‘BOTRADING’.


