Created with Plotly
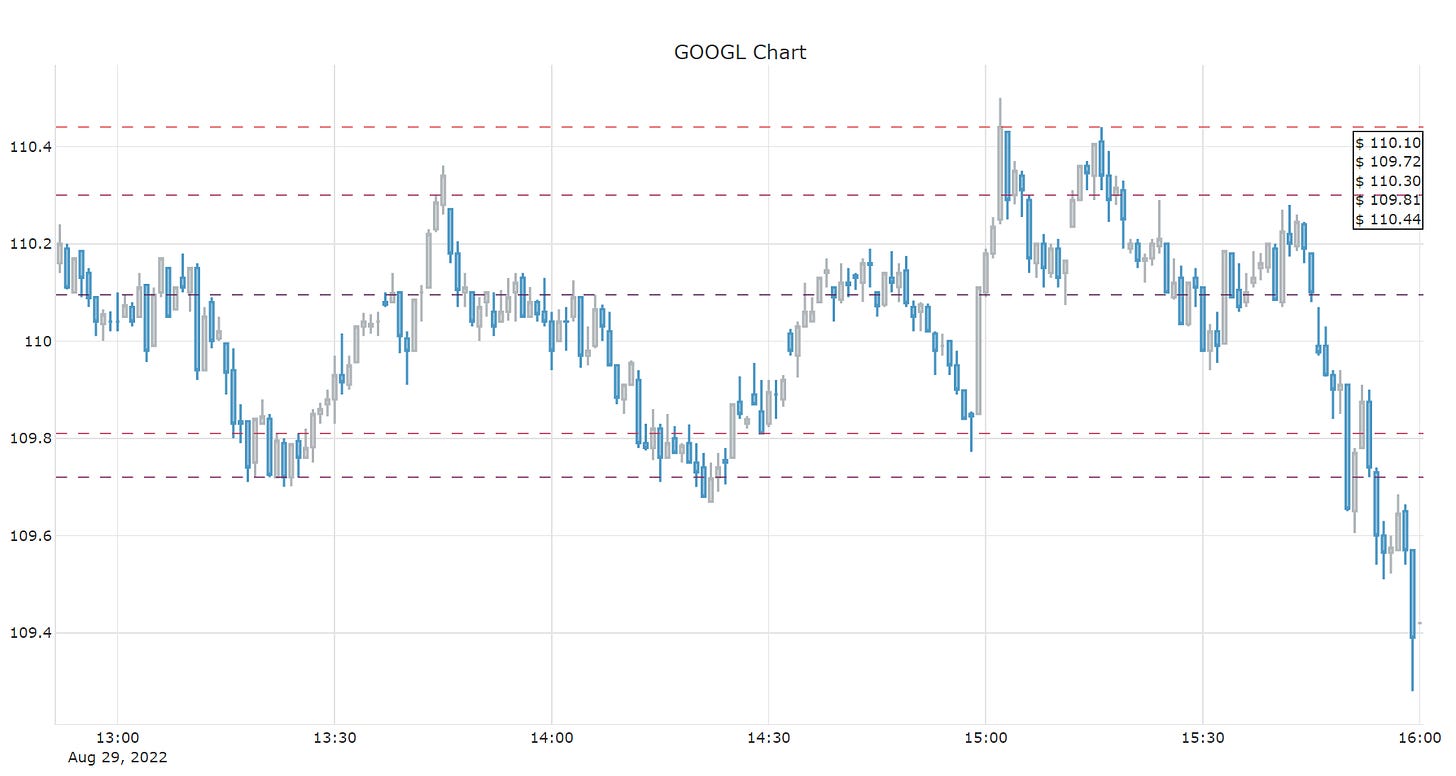
I recently came across this StackOverflow thread that used a different way to calculate support and resistance levels by using Agglomerative Clustering which I wanted to share.
This story is solely for general information purposes, and should not be relied upon for trading recommendations or financial advice. Source code and information is provided for educational purposes only, and should not be relied upon to make an investment decision. Please review my full cautionary guidance before continuing.
What is Support and Resistance?
The concepts of Support and Resistance are used in technical analysis to identify upper and lower price boundaries with the intent to recognize trends when the price moves past these boundaries.
Support is a lower price boundary that forms when there is a concentration of demand for an asset.
Conversely, Resistance is an upper price that forms when thee is a concentration of supply for an asset.
What is Agglomerative Clustering?
Agglomerative Clustering is a method of clustering that seeks to build a hierarchy of clusters by using a ‘bottom-up’ approach to find clusters, and group them into clusters as the algorithm moves up the hierarchy.
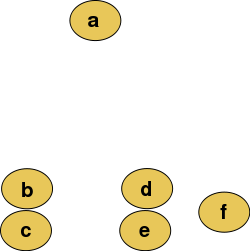
This approach becomes more clear when we look at the diagrams below.
Source: Wikipedia, Creative Commons 3.0 license
Here you can see a number of distributed items, which in our case could be the price of an investment instrument.
The Agglomerative Clustering algorithm now starts at the bottom (near c/e) and moves it’s way up (to a) forming clusters at each step.
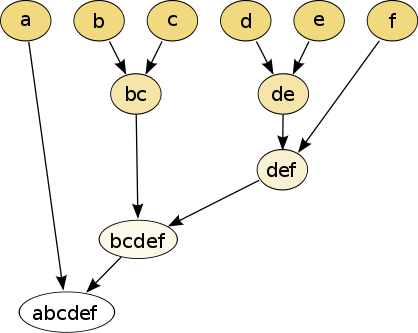
Source: Wikipedia, Creative Commons 3.0 license
The algorithm forms a tree that looks like the one above where on the first level b/c and d/e are clustered together. On the second level d/e/f are clustered. On the next level b/c/d/e/f and finally a is added to the cluster.
When we apply this method to support and resistance, this approach would start with the lower prices and cluster them together and then form clusters at each price range as the algorithm moves it’s way up to the higher price levels.


