Evaluating Industry Sector Performance (Python Tutorial)
According to Investopedia.com, “A diversified stock portfolio will hold stocks across most, if not all, GICS sectors. Diversification across stock sectors helps to mitigate idiosyncratic or unsystematic risks caused by factors affecting specific industries or companies within an industry.”
When planning a portfolio diversification by industry sector, it is important to know which sectors are currently doing well and which do not.
One way to do this is by evaluating long-term and short-term performance of SPDR Sector funds. In this post we are going to go over the steps on how to do this in Python.
This story is solely for general information purposes, and should not be relied upon for trading recommendations or financial advice. Source code and information is provided for educational purposes only, and should not be relied upon to make an investment decision. Please review my full cautionary guidance before continuing.
What are SPDR Sector Funds?
SPDR Sector funds are Exchange-traded funds (ETFs) that divide the stocks that make up the S&P 500 into 11 sectors, e.g. real estate or communications. Instead of having to select and invest in individual companies from each sector to diversify their portfolio, investors can invest in these ETFs.
Naturally, using SPDR Sector Funds is just a rough measure of sector performance since it only contains a subset of stocks that are part of the S&500. A more accurate way would be to measure the returns for all publicly traded stocks belonging to an industry sector.
Here the list of SPDR Sector funds with their corresponding symbol:
Communication Services (XLC)
Consumer Discretionary (XLY)
Consumer Staples (XLP)
Energy (XLE)
Financials (XLF)
Health Care (XLV)
Industrials (XLI)
Materials (XLB)
Real Estate (XLRE)
Technology (XLK)
Utilities (XLU).
Trade Ideas provides AI stock suggestions, AI alerts, scanning, automated trading, real-time stock market data, charting, educational resources, and more. Get a 15% discount with promo code ‘BOTRADING15’.
Tutorial Overview
Here’s what we are going to cover in this tutorial:
Fetch one year and last quarter prices for each sector fund
Calculate performance for each period and sector fund
Sort by sectors with the highest performance
Print results
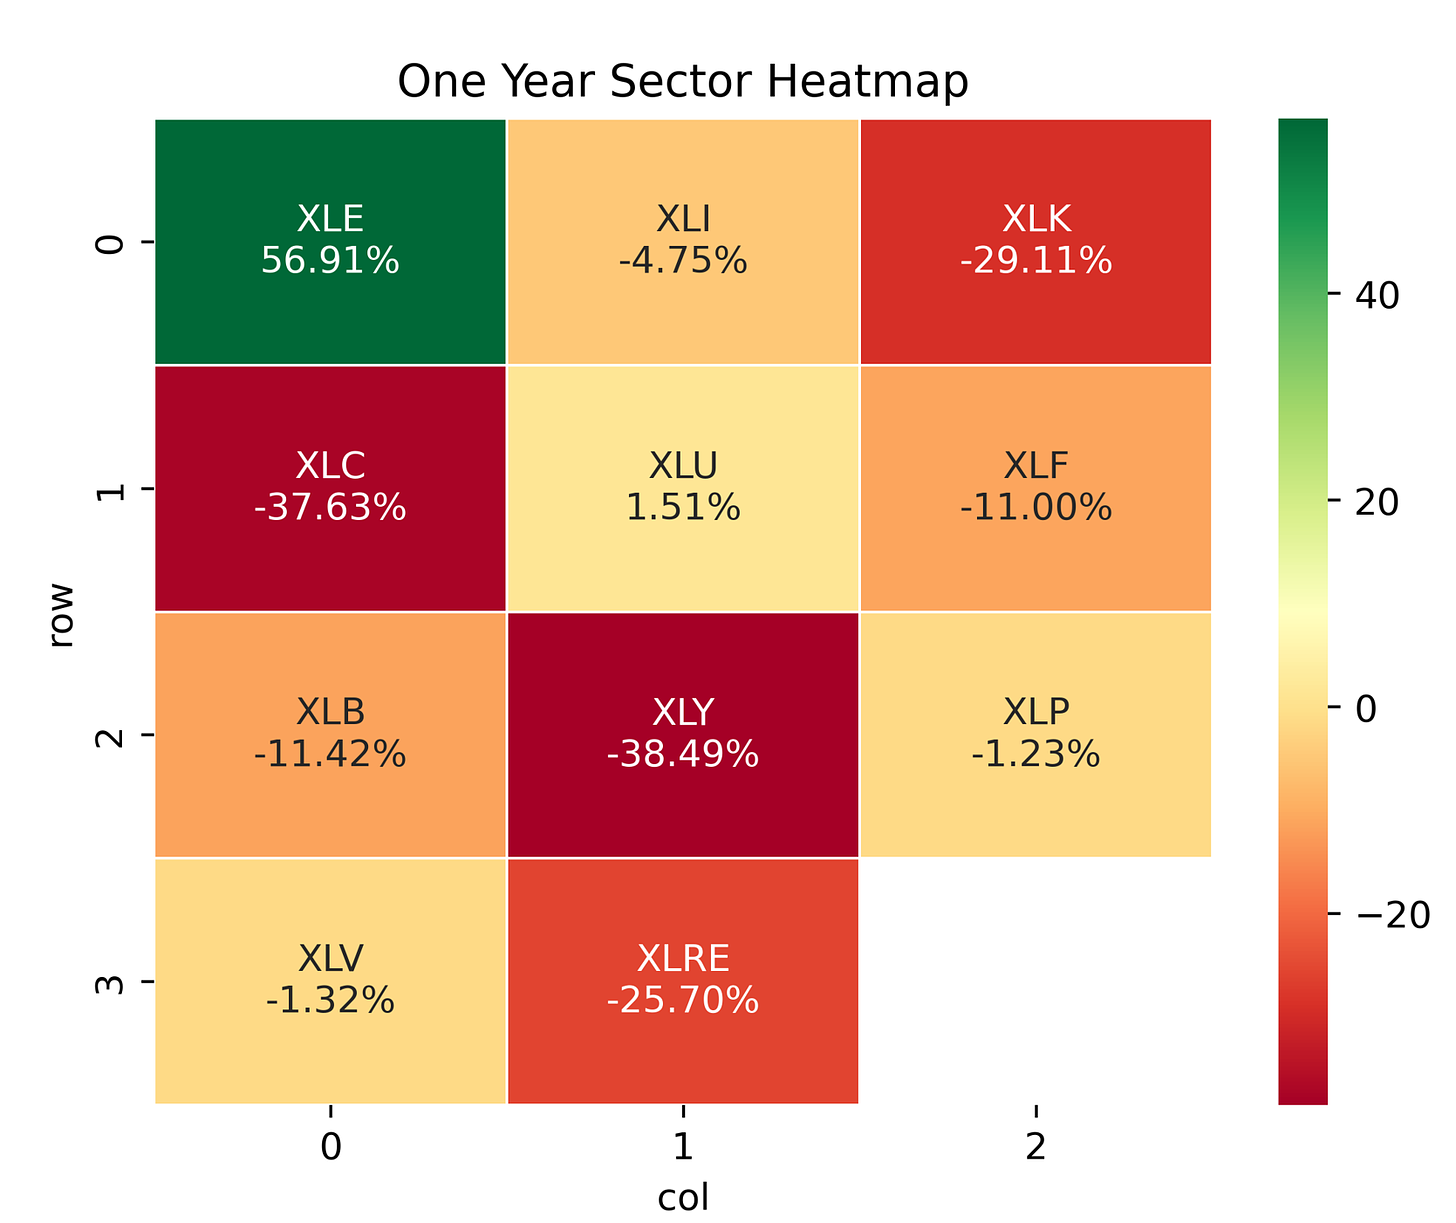
Create and save a heat map of short-term and long-term performance for all sector funds.
Get a 15% discount for Trade Ideas with promo code ‘BOTRADING15’. Trade Ideas provides AI stock suggestions, AI alerts, real-time market data, charting, scanning, automated trading, educational material, and more.


