Gaussian Filters - The Swiss Army Knife of Algorithmic Trading (Python Tutorial)
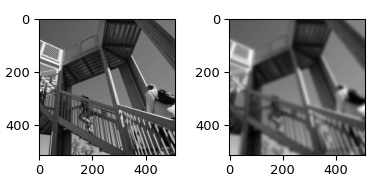
Gaussian filters can be used for all kinds of fun stuff from image processing to computer vision applications and signal processing. Check out these images that were blurred using the Scipy Python library gaussian_filter.
Image sample from the Scipy gaussian_filter documentation
Gaussian filters can also be used for algorithmic trading, for example to smooth price lines, remove outliers and generate signals. They are an amazing tool, like a Swiss Army knife that incorporates multiple technical indicators into one.
In this tutorial we are going to have some fun with these filters and master another tool that we can add to our algorithmic trading tool belt.
This story is solely for general information purposes, and should not be relied upon for trading recommendations or financial advice. Source code and information is provided for educational purposes only, and should not be relied upon to make an investment decision. Please review my full cautionary guidance before continuing.
What are Gaussian Filters?
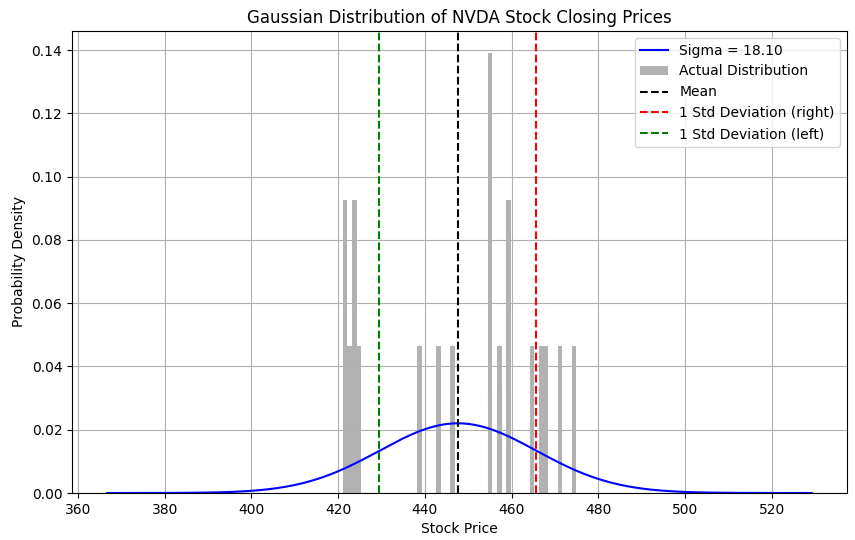
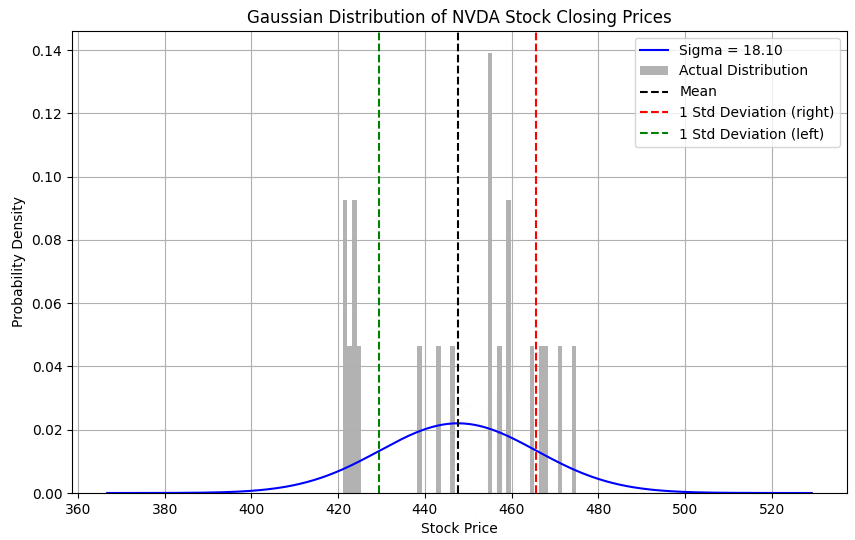
What are Gaussian Filters mean in the context of a time series of prices? Let’s say we take a set of prices for a number of dates, for example stock prices of Nvidia for the past 30 days and calculate the average price. If you present the prices on a bell curve graph as shown below with the prices on the x-axis and the probability of their occurrence on the y-Axis, the average would be right in the center of the curve. The red and green lines show the first standard distribution of the prices.
As you move away from the average peak of the bell curve, these are days where the prices were further away from the average price we calculated.
A wide bell curve means that there was a lot of price volatility during this month whereas a narrow curve means that that there was more stability.
When we talk about Gaussian Filters in this context, they could be described as taking a small section of this bell curve and applying it to the time series of price data like a sliding window. Sudden spikes and drops are getting ironed out by the smoothing nature of the Gaussian Filter.
Like EMAs, Gaussian Filters give more importance (weight) to data points that are close to the current data point and less importance to those further away.
Here are some advantages of using Gaussian Filters compared to using EMAs in algorithmic trading:
Gaussian Filters introduce less lag than EMAs, which is crucial for generating trading signals.
Gaussian Filters provide more options for customization by changing the standard deviation and poles.
Gaussian filters offer a more uniform response to price changes. They are less reactive to sudden price changes, which can help prevent false signals in volatile markets.
I don’t want to get into the detailed mathematical calculation of Gaussian Filters in this post but if you are interested, here are links for further reading:
What are Poles?
You may have heard of the term ‘pole’ in combination with Gaussian Filters. For example, in TradingView you find indicators with a name like ‘N-Pole Gaussian Filter...”.
Here the term ‘pole’ refers to the number of passes the Gaussian Filter was applied to the data. With every pass, the smoothing effect becomes stronger. Think of an image that you blur multiple times increasing the effect being applied to the image.
Applications of Gaussian Filters in Trading
Here a couple of ways Gaussian Filters can be used in algorithmic trading:
Trend Identification: Like many other filters and moving averages, the Gaussian filter can be used to determine the direction of the trend. If the price is above the Gaussian line and the line is sloping upward, it often indicates an uptrend. If the price is below the Gaussian line and the line is sloping downward, it may indicate a downtrend.
Standard Deviation Bands: Traders sometimes plot bands around the Gaussian Filter, where the width of these bands is a multiple of the standard deviation of the price from the Gaussian Filter line. These bands are similar to Bollinger Bands, providing dynamic support and resistance levels and indicating overbought or oversold conditions.
Signal Generation: Crosses between the price and the Gaussian Filter line, or between a shorter Gaussian Filter and a longer one, can be used to generate trading signals.
Filtering Out Noise: The primary purpose of the Gaussian Filter is to smooth out price data and reduce random fluctuations. This makes it easier to identify genuine trends and avoid false trading signals.
Calculating Pivot Points: Due to the smoothing factor of the Gaussian Filter, the corresponding lines lend themselves for calculating pivot points. By changing the sigma value and pole values, the placement of pivots can be adjusted.
Next, let’s see how we can implement Gaussian Filters in Python.
StockDads.com is a thriving trading community with AI trading stock/crypto alerts, expert advice and a ton of educational materials. Get a 30% forever discount with code ‘BOTRADING’


