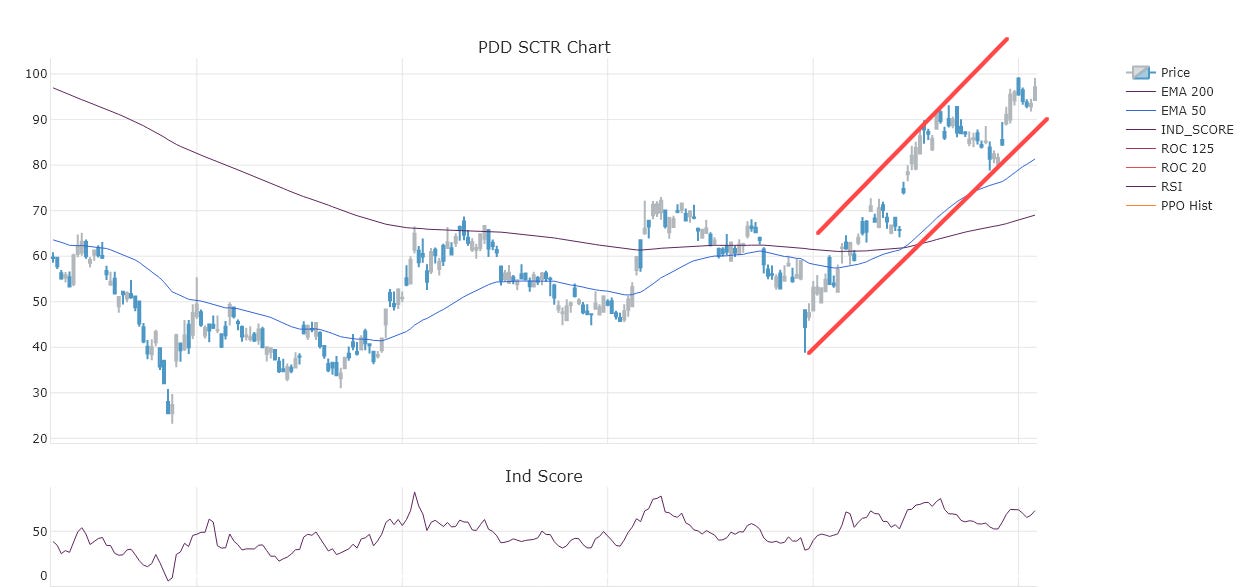
I’ve been searching for a solid way to rank stocks in a group to find the strongest or weakest candidates for investment. Recently, I have found the StockCharts.com Technical Rank (SCTR), which can be used for this purpose.
In this post we are going to discuss what the SCTR is, how it is calculated, go over the SCTR implementation in Python and look at some of the results of this ranking system.
This story is solely for general information purposes, and should not be relied upon for trading recommendations or financial advice. Source code and information is provided for educational purposes only, and should not be relied upon to make an investment decision. Please review my full cautionary guidance before continuing.
What is stockcharts.com?
Stockcharts.com is a website that analyzes and plots stock data from the US and around the world.
It can be used for investment decisions, to help a trader understand how their stocks are performing in comparison to the market, or for pure entertainment purposes. The site also offers technical analyst blogs, live streaming quotes, real time charts with on-chart indicators like MACD, RSI, Average True Range (ATR), as well as news feeds and portfolio tools.
Trade Ideas provides AI stock suggestions, AI alerts, scanning, automated trading, real-time stock market data, charting, educational resources, and more. Get a 15% discount with promo code ‘BOTRADING15’.
What’s the StockCharts Technical Rank?
The StockCharts Technical Rank (SCTR) is a proprietary ranking indicator developed by https://stockcharts.com, which ranks a stock in relation to it’s peers in a group of stocks.
The methodology for this ranking system was developed by John Murphy, a technical analyst who authored several books including ‘Technical Analysis of the Futures Market’.
You can find a detailed description of the SCTR on the stockcharts.com website.
In order to calculate the SCTR, Stocks are assigned a score based on six key indicators in three groups: long-term, medium-term and short-term. These scores are then sorted and assigned a SCTR rank.
The SCTR indicator is heavily used on the StockCharts.com website in charting tutorials, sample user charts as well as the analyst blogs.
And advantage of the SCTR is that it only uses price data and is relatively easy to calculate, that it considers multiple time frames and that it uses both trend and momentum indicators.
A disadvantage is that the framework doesn’t consider other common ranking criteria such as news & social media sentiment or company growth and value indicators.
How is the SCTR calculated?
The following information to calculate the SCTR is based on the stockcharts.com website. The SCTR is calculated as follows:
Long-Term Indicators
Percentage of price above/below the 200-day EMA (weight: 30%)
125-day Rate-of Change (weight: 30%)
Medium-Term Indicators
Percentage of price above/below the 50-day EMA (weight: 15%)
20-day Rate-of-Change (15%)
Short-Term Indicators
3-day slope of the PPO (params: 12, 26, 9) with Histogram / 3 (weight: 5%). The PPO-Histogram is the difference between the PPO and its 9-day EMA
14-day RSI (5%)
Once all the indicators are weighted, the indicator score is calculated by adding all weighted indicator values together.
The group of stocks is then sorted by indicator score and a technical rank from 0.0 to 99.99 is assigned in order of the score.
Next, 10 buckets are created and the stocks are assigned to each of the buckets based on their assigned technical rank.
The stocks in the lowest score bucket (the bottom 10%) are considered the weakest stocks in the group and the stocks in the highest score bucket (the top 10%) are considered the strongest.
What is the Rate-of-Change (ROC) indicator?
The ROC indicator is a momentum oscillator. It measures the rate of change between closing prices over a pre-specified period (default: 10 days).
When the ROC rises above zero, the stock is considered in an uptrend. When the ROC falls below zero, the stock is considered in a downtrend.
What is the PPO?
The PPO indicator (PPO) is a technical momentum indicator that shows the difference between two EMA values: Normally, the MA of a 26-period and 12-period. A signal line as the EMA of the PPO is added.
When the PPO is above zero, it indicates an upwards trend. When the PPO is below zero, it indicates a downward trend.
The Game Plan
Here’s what we are going to cover in the implementation section:
As a universe for this post, we will use the NASDAQ 100 price list to have a manageable number of stocks. This is just and example - you can use another universe if you prefer.
For each stock, calculate component indicators.
Calculate the indicator score
Assign the Technical Rank
Sort by highest to lowest Technical Rank
Print out the top 10 strongest stocks
Plot the daily chart of the stock with the highest/lowest SCTR scores
Sounds easy enough? Then let’s get started.


