How to optimize the Chandelier Exit Strategy for Crypto (Python)
Photo by Marcos Ferreira on Unsplash.com
This post is the second part of ‘How to run a Chandelier Exit Strategy for Crypto in Python’ in which we are going to go through the steps of optimizing the strategy. If you haven’t already, you may want to read it first here .
This story is solely for general information purposes, and should not be relied upon for trading recommendations or financial advice. Source code and information is provided for educational purposes only, and should not be relied upon to make an investment decision. Please review my full cautionary guidance before continuing.
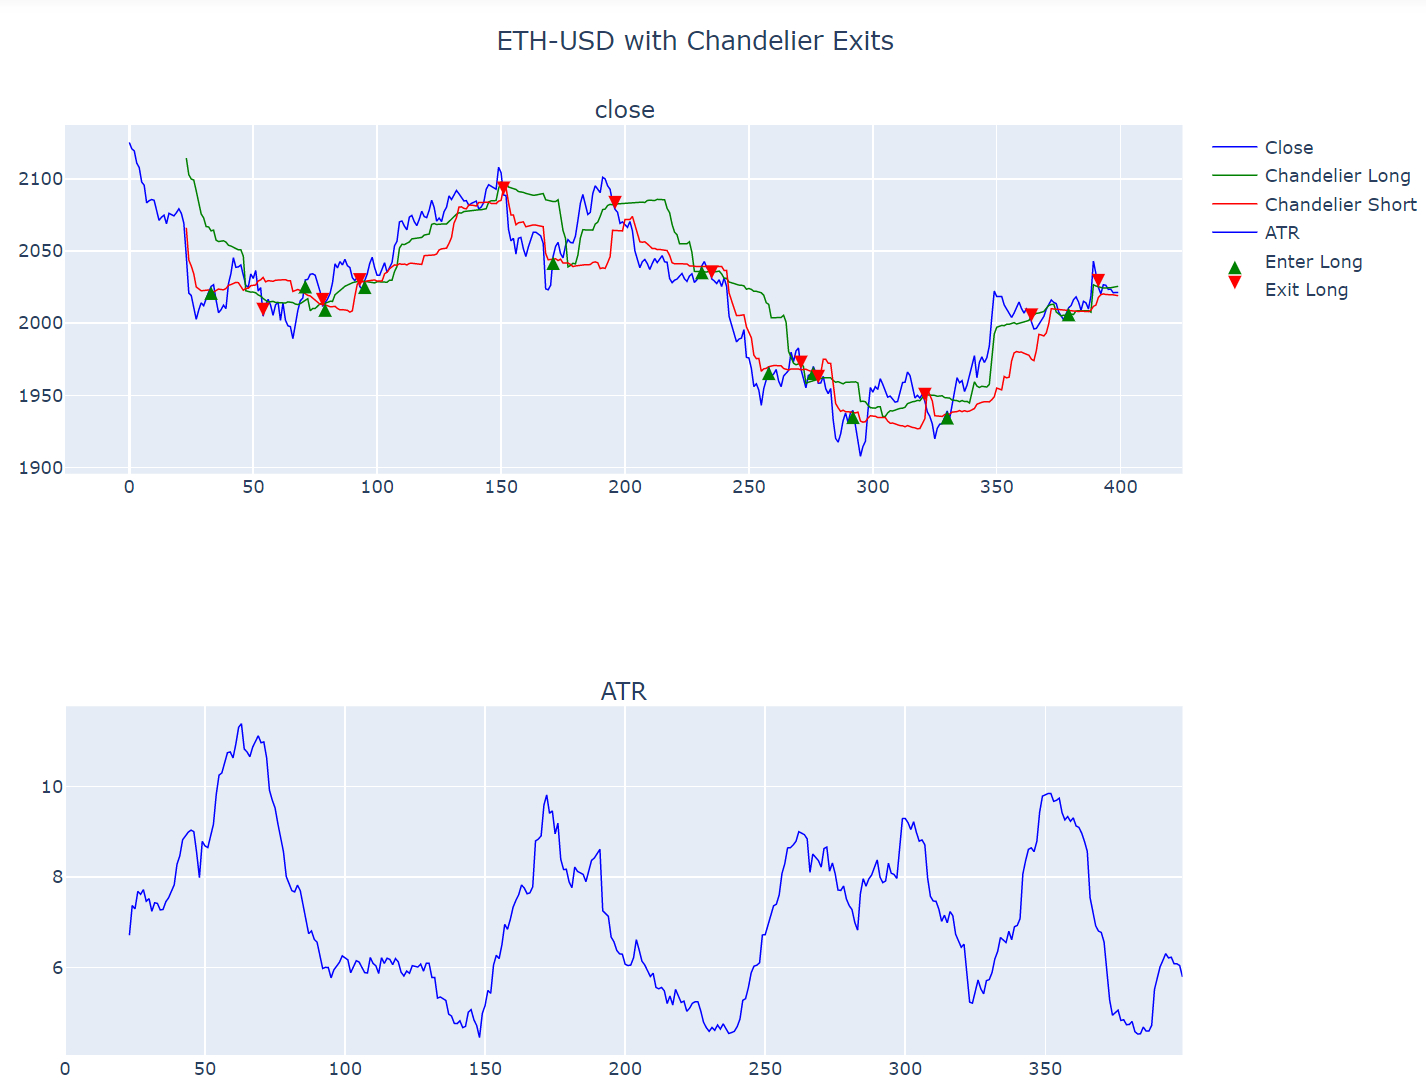
In the first part of the blog post, we found that the strategy showed some potential, as you can see here for example in the 400 period 15 minute chart of ETHUSD. The strategy seemed to set well-timed entry and exit points for the coin and yielded a $12 profit with a $100 investment, which seemed worth reviewing.
Image created with Plotly
In the second part, we are going to try to optimize this strategy and I will go over the steps on how to do this using Python.
Recap - What are Chandelier Exits?
The Chandelier Exit (CE) is a technical indicator based on the Average True Range (ATR) that identifies stop loss exit points for long and short trades.
Chandelier Exits are called that because they are ‘hanging’ below (or above) the price line like chandeliers.
Image created with Plotly
The blue candlestick line is the price during an upward trend. The blue line below is the long chandelier. When the blue line changes trend direction and crosses the red chandelier line, this triggers the sell signal. Like a trailing stop loss.
The short chandelier exit works in inverse mode. When the downward trend changes into an upward trend and the price crosses the green chandelier line, this is out exit signal for the short trade.
Chandelier Exits are traditionally used as a timing indicator for trailing stop loss. However, we are going to use them to provide entry and exit signals for long and short calls.
Optimization Steps
One of the nice things about algorithmic trading is that you can use whatever programming language you use to play out different strategies and find out if the end result changes. This saves you a hell of a lot of manual trial and error. That’s what we are going to try in this post.
The key to optimize the Chandelier Strategy is to think about what are the variable input parameters and then vary them in an automated way and find out which combination of parameters yields the best results.
For the Chandelier Strategy, these are the variable parameters I used:
The ATR period. The default is 22 for 22 business days.
The Chandelier lookback period. The default is 22 as well.
The data period. The default is 1 business day.
Whether to use a stop loss or not.
The coins themselves.
Next, you want to define minimum and maximum ranges for each parameter you would like to test. For example, for ATR I chose a minimum of 10 periods and a max of 30. For the data period, I chose periods from 1 minute to 1 hour.
Once we defined the ranges, we can go ahead and place them in arrays.
Next, in order to find the best combination of these input parameters, we can iterate through them in loops, execute the strategy using the combinations as input and calculate the profit. In some cases if there are many combinations this may take a long time but in this case it doesn’t.
For each combination, we are going to execute the strategy and calculate the profit. Then we can sort the results by the highest profit and find out which combination provided the highest result.
Next, we will go to go over the strategy optimization in Python.


