How to run a Chandelier Exit Strategy for Crypto (Python)
Photo by William Krause on Unsplash.com
I admit I’m a bit of a sucker for catchy subjects on Medium that promise to rake in a lot of cash and I’m always ready to try them out myself but then again, who isn’t? Sooooo, this subject by ‘BitcoinShrimps’ caught my eye: ‘How to earn 82% in 2 weeks with this simple trading strategy’.
So, I thought ‘What the heck. My crypto holdings are basically worthless so might as well put a new strategy to a test’. And come on, who wouldn’t want to go into early retirement with the farewell speech that finishes off with the phrase ‘I’m leaving because I made a million bucks with a tip from BitcoinShrimps’. Ha, ha, ha. I sure do.
So I implemented the strategy myself and that’s what this post is about.
This story is solely for general information purposes, and should not be relied upon for trading recommendations or financial advice. Source code and information is provided for educational purposes only, and should not be relied upon to make an investment decision. Please review my full cautionary guidance before continuing.
What the heck are Chandelier Exits?
The Chandelier Exit (CE) is a technical indicator based on the Average True Range (ATR) that identifies stop loss exit points for long and short trades.
It was initially developed by expert technical analyst Chuck Le Beau. In 2002, the CE indicator was popularized to the trading community by Alexander Elder in his book “Come into my trading room”.
Traditionally, CEs are used as a method to identify trend reversal and to time trailing stop losses.
The Average True Range (ATR) is a volatility-based indicator developed by trader J. Welles Wilder Jr. and published in his book ‘New Concepts in Technical Trading Systems’.
The ATR calculates the differences between the high and low price during the current previous days and then calculates the moving average based on a specific period of time, e.g. 22 days.
Check out the ATR calculation formula on Infopedia.com
The Chandelier Exits for long and short are then calculated by using a certain lookback period (e.g. 22 units) and finding the maximum high and low price during that period. Then the corresponding values are adjusted by the ATR, normally multiplied by a multiplier like 3.
Long Chandelier Exit = MAX(22-day High) - ( ATR (period 22) x 3 )
Short Chandelier Exit = MAX(22-day Low) + ( ATR (period 22) x 3 )
What do Chandelier Exits look like?
Chandelier Exits are called that because they are ‘hanging’ below (or above) the price line like chandeliers.
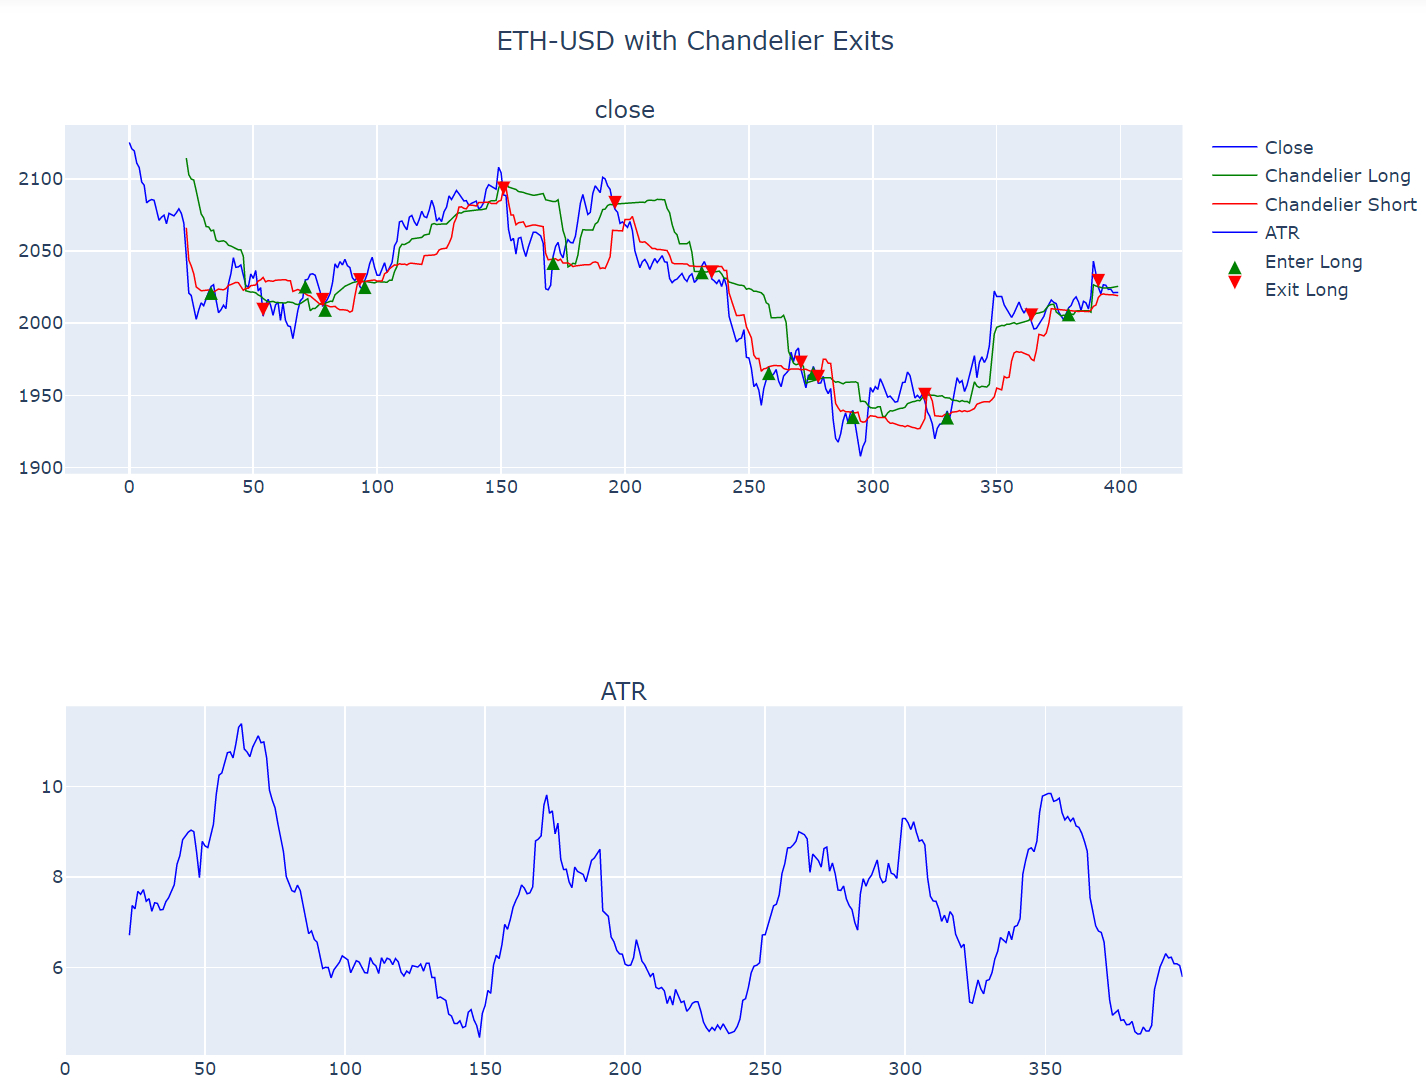
Let’s take a look at the graph below.
The blue candlestick line is the price during an upward trend. The blue line below is the long chandelier. When the blue line changes trend direction and hits the blue chandelier line, this triggers the sell signal. Like a trailing stop loss.
The short chandelier exit works in inverse mode. When the downward trend changes into an upward trend and the price crosses above the short chandelier line, this is out exit signal for the short trade.
Image created with Plotly
The Chandelier Exit Strategy
As it was mentioned above, traditionally CEs are used as an indicator to time trailing stop loss exits. However, in this post we are actually going to repurpose them to generate entry and exit signals for us.
But how does that work?
We will use the Chandelier Short Exit as our long entry signal
The Chandelier Long Exit will be our long exit signal
The Chandelier Long Exit will be our short entry signal
The Chandelier Short Exit will be our short exit signal.
But wait, is really a good idea to repurpose a trailing exit strategy to generate trading signals? We will see in the results below.


