The hidden Meaning of Candlesticks (Python Tutorial)
The hidden Meaning of Candlesticks (Python Tutorial)

Data sourced with Tiingo API
In this tutorial I would like to discuss how candlestick shapes can be interpreted to derive market sentiment and how this approach can be used in algorithmic trading.
How does this approach differ from candlestick patterns? Candlestick patterns are very specific shapes of single candles or candle formations that occur often and are associated with a specific sentiment. For example, the Hammer candlestick pattern is associated with a bullish sentiment.
In this post we are going to talk how the different parts of a single candle shape relate to sentiment, which can lead to a better understanding of candlestick patterns.
This story is solely for general information purposes, and should not be relied upon for trading recommendations or financial advice. Source code has not been tested and should not be used for live trading. Please review my full cautionary guidance before continuing.
The Parts of a Candle
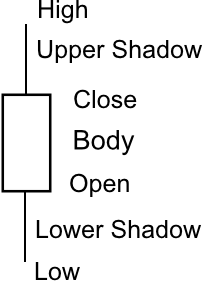
I’m sure everyone is familiar with the basic shape of a candle but let’s review the different parts before we dive into the details.
Below is an example, where the Close price is higher than the Open price so the body of the candle is hollow. At the top we have the High price and the candle wick or upper shadow. Below the candle body we have the lower shadow and the Low price.
Below is an example where the Close price is lower than the Open price so the body of the candle is filled.
