I recently wrote a post on how to implement the Vuman Chu Swing Indicator. In this tutorial I would like to show how this indicator can be used in a trading strategy.
The Vuman Chu Swing Indicator has over 3,400 Boosts on Trading view and is used in several trading strategies presented on YouTube.com for example this one: ‘$100 to 10,000 Crypto Trading Strategy - Easy Profitable Strategy‘ by ‘Crypto Giant’.
This story is solely for general information purposes, and should not be relied upon for trading recommendations or financial advice. Source code and information is provided for educational purposes only, and should not be relied upon to make an investment decision. Please review my full cautionary guidance before continuing.
Indicators Used
VuManChu Swing Indicator
The VuMan Chu Swing Indicator is a range filter indicator implementation on Tradingview.com. The indicator implementation is based on a range filter script by DonovanWall, which can be found here.
The indicator measures price ranges and changes during a certain time period to determine up- or downward trends.
The script features the range filter itself, up- and downward indicators, high- and low bands and long/short entry indicators.
This indicator is an open-source Pine Script implementation licensed under Mozilla Public License v2.0.
What is a range filter?
According to fxempire.com, the range filter is a technical analysis tool used to measure the limits of price movement during a certain time period. As the author states, markets are only engaged in up trends and down trends 15% to 20% of the time, with the majority of the time spent between trading ranges.
These ranges can be relatively narrow or wide. The range filter tries to predict future trends by determining the characteristics of the price movements within the ranges.
The Strategy
Long Entry
The Vuman Chu range filter (Period: 20 seconds, Multiplier: 3.5) changes from negative to positive
Long Exit
The Vuman Chu range filter (Period: 20 seconds, Multiplier: 3.5) changes from positive to negative or
Stop loss at 15%
Short Entry
Reverse rules of long entry
Short Exit
Reverse rules of long exit
Implementation
You can find the complete Python script on my GDrive repo here.
First we need to import the necessary Python packages:
import os
from pandas.tseries.holiday import USFederalHolidayCalendar
from pandas.tseries.offsets import CustomBusinessDay
US_BUSINESS_DAY = CustomBusinessDay(calendar=USFederalHolidayCalendar())
import os
from pandas.tseries.holiday import USFederalHolidayCalendar
from pandas.tseries.offsets import CustomBusinessDay
US_BUSINESS_DAY = CustomBusinessDay(calendar=USFederalHolidayCalendar())
from os.path import exists
import pandas as pd
from backtesting import Strategy
from backtesting import Backtest
import pandas_ta as ta
from ta_utils import *
import math
These variables are setting the paths to the data.
This is a helper function to load the OHLC crypto data file.
def load_data_file(symbol, interval):

    file_path = os.path.join(DATA_PATH, f"{symbol}_{interval}_ohlc.csv")
    if not exists(file_path):
        print(f"Error loading file {file_path}")
        return None

    #  Load data file
    df = pd.read_csv(file_path)
    if df is None or len(df) == 0:
        print(f"Empty file: {file_path}")
        return None

    #  Shorten df for testing
    #df = df.iloc[10000:20000]

    #  Rename columns
    df = df.rename(columns={"open": "Open", "close": "Close", "low": "Low", "high": "High", "volume": "Volume"})

    df['Date'] = pd.to_datetime(df['unix'], unit='s', utc=True)
    df = df.drop(['unix'], axis=1)
    df = df.set_index('Date')

    #  Drop na
    df.dropna(axis=0, how='any', inplace=True)

    return df
The functions are calculating the EMA and the Vuman Chu Swing indicator.
def range_size(df: pd.DataFrame, range_period: float, range_multiplier: int):
    wper = range_period * 2 - 1
    # last candle is last index, not 0
    average_range = ta.ema(df.diff().abs(), range_period)
    AC = ta.ema(average_range, wper) * range_multiplier
    return AC


def range_filter(x: pd.DataFrame, r: pd.DataFrame) -> pd.DataFrame:
    range_filt = x.copy()
    hi_band = x.copy()
    lo_band = x.copy()

    for i in range(x.size):
        if i < 1:
            continue
        if math.isnan(r[i]):
            continue
        if x[i] > nz(range_filt[i - 1]):
            if x[i] - r[i] < nz(range_filt[i - 1]):
                range_filt[i] = nz(range_filt[i - 1])
            else:
                range_filt[i] = x[i] - r[i]
        else:
            if x[i] + r[i] > nz(range_filt[i - 1]):
                range_filt[i] = nz(range_filt[i - 1])
            else:
                range_filt[i] = x[i] + r[i]

        hi_band[i] = range_filt[i] + r[i]
        lo_band[i] = range_filt[i] - r[i]

    return hi_band, lo_band, range_filt


def nz(x) -> float:
    res = x
    if math.isnan(x):
        res = 0.0

    return res


def vumanchu_swing(df, swing_period, swing_multiplier):
    smrng = range_size(df['Close'], swing_period, swing_multiplier)
    hi_band, lo_band, range_filt = range_filter(df['Close'], smrng)
    return range_filt
This is the backtesting.py strategy implementation.
We first define all the parameters we need for the technical indicators.
In the init() method, we calculate theVuman Chu range filter
In the next() method, we are checking the strategy entry and exit rules for long and short positions.
Based on the strategy rule results, we perform long and short entry and exits.
class MixedStrategy(Strategy):
    ema_period_1 = 50
    ema_period_2 = 200
    ema_lookback = 50

    swing_period = 20
    swing_multiplier = 3.5

    stop_loss_percent = 15

    last_purchase_price = 0
    long_hold = 0
    short_hold = 0
    i = 0

    def init(self):
        super().init()

        #  Calculate indicators
        self.range_filter = self.I(vumanchu_swing, self.data.df, self.swing_period, self.swing_multiplier)

    def next(self):
        super().init()

        self.i += 1

        long_entry_signals = 0
        long_exit_signals = 0
        short_entry_signals = 0
        short_exit_signals = 0

        #  Check Vuman Chu Range Filter
        if self.range_filter[-1] > self.range_filter[-2]:
            long_entry_signals += 1
            short_exit_signals += 1

        if self.range_filter[-1] < self.range_filter[-2]:
            long_exit_signals += 1
            short_entry_signals += 1

        #  Stop loss
        price = self.data.df['Close'][-1]
        if price <= self.last_purchase_price * (1 - self.stop_loss_percent/100):
            long_exit_signals += 1

        if price >= self.last_purchase_price * (1 + self.stop_loss_percent/100):
            short_exit_signals += 1

        #  LONG
        #--------------------------------------------------
        if self.long_hold == 0 and long_entry_signals >= 1:
            #  Buy
            self.long_hold = 1
            self.position.close()
            self.buy()
            self.last_purchase_price = price

        elif self.long_hold == 1 and long_exit_signals >= 1:
            # Close any existing long trades, and sell the asset
            self.long_hold = 0
            self.position.close()
            self.last_purchase_price = 0

        #  SHORT
        #--------------------------------------------------
        if self.short_hold == 0 and short_entry_signals >= 1:
            #  Sell
            self.short_hold = 1
            self.position.close()
            self.sell()
            self.last_purchase_price = price

        elif self.short_hold == 1 and short_exit_signals >= 1:
            # Close any existing long trades, and sell the asset
            self.short_hold = 0
            self.position.close()
            self.last_purchase_price = 0
This function creates the backtesting.py backtest and passes the starting capital and comission. It also instantiates the Strategy class.
def run_backtest(df):
    # If exclusive orders (each new order auto-closes previous orders/position),
    # cancel all non-contingent orders and close all open trades beforehand
    bt = Backtest(df, MixedStrategy, cash=1000, commission=.00075, trade_on_close=True, exclusive_orders=False, hedging=False)
    stats = bt.run()
    print(stats)
    bt.plot()
Finally, here is the main function, which loads the data file and calls the run_backtest() function.
# MAIN
if __name__ == '__main__':
    symbol = 'LTC-USD'
    df = load_data_file(symbol, '5m')

    #  Run backtest
    run_backtest(df)
Results
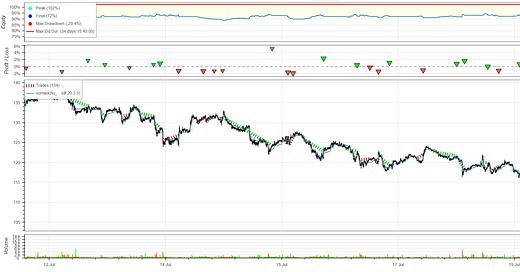
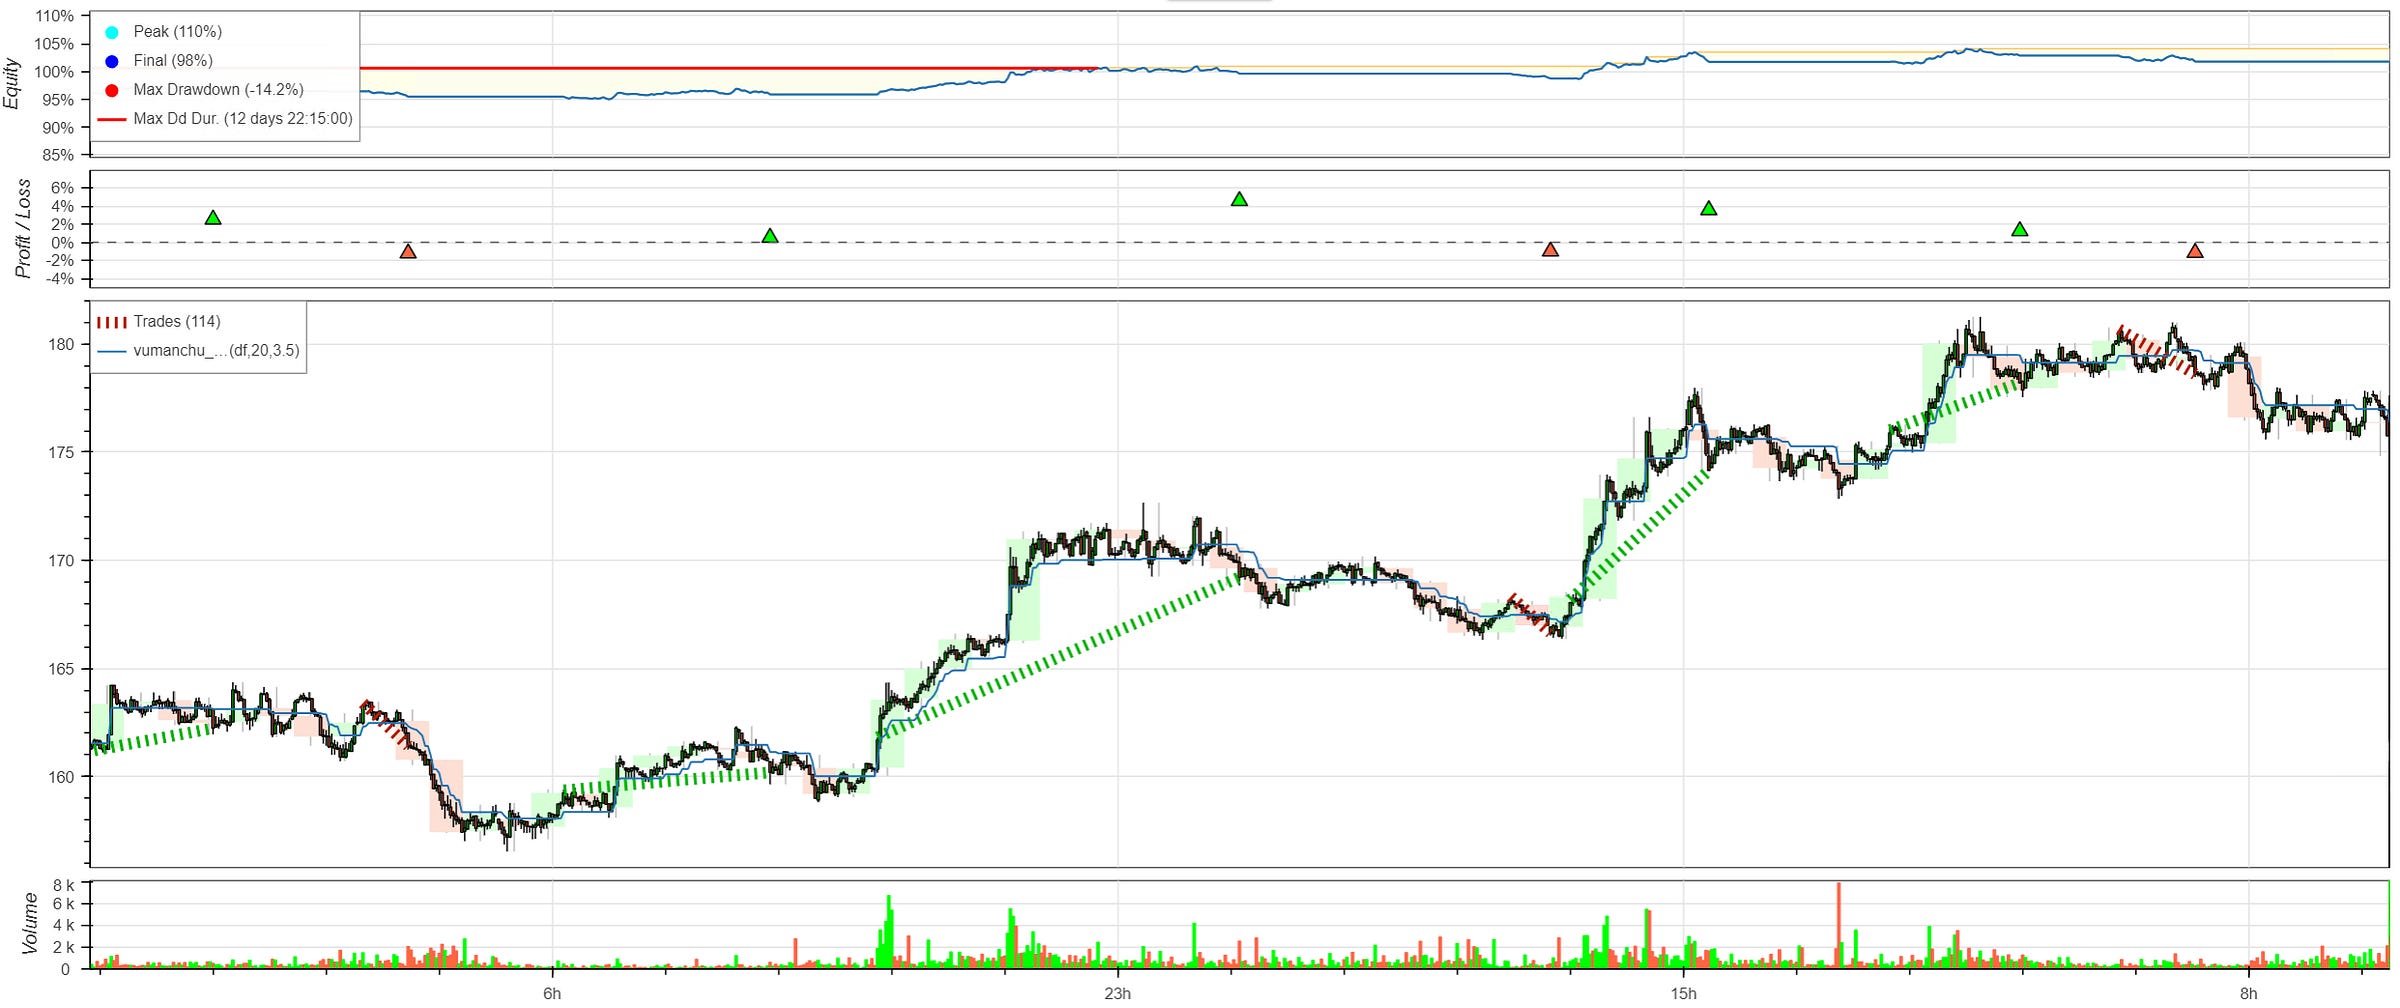
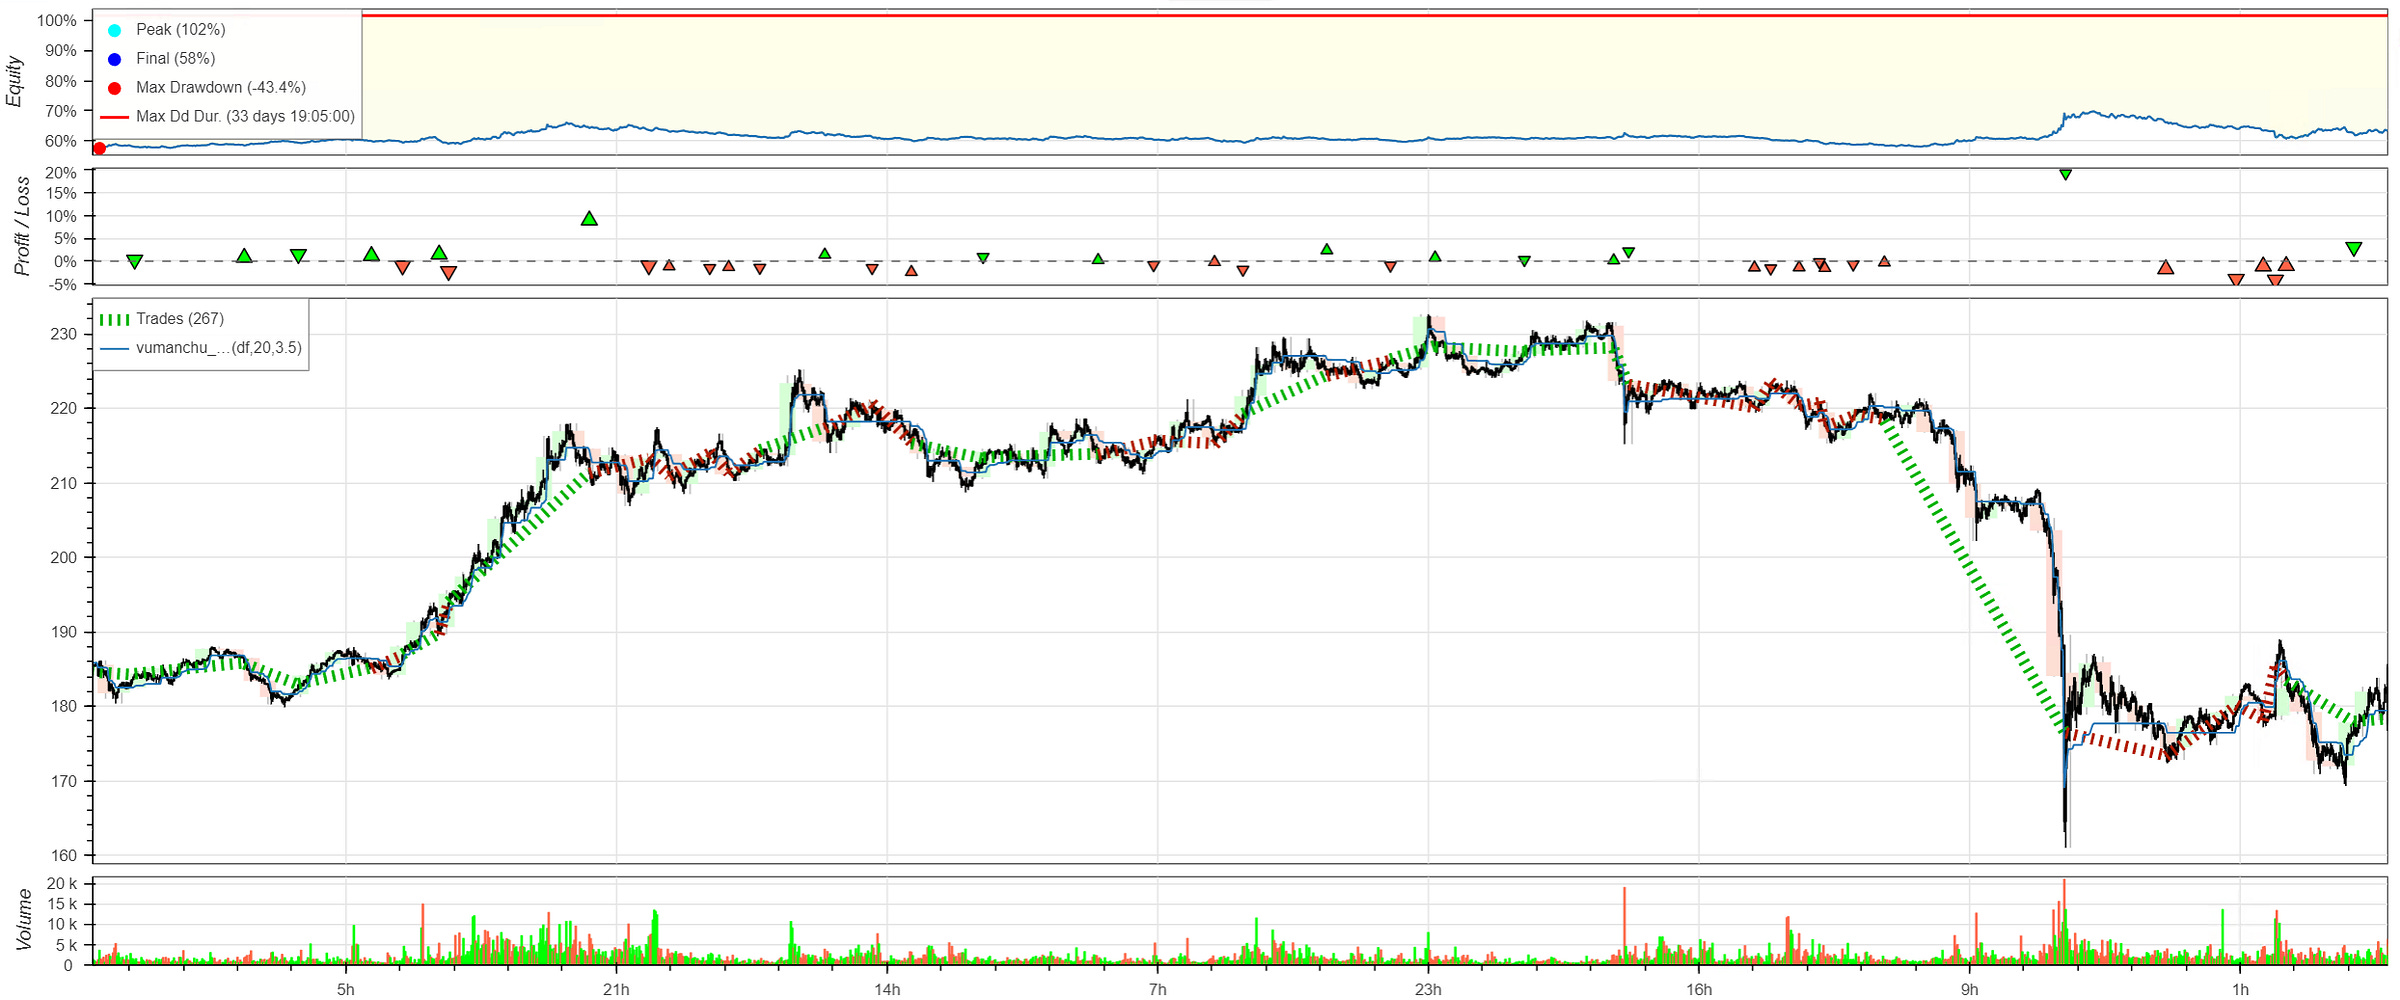
The chart below was created using 5-minute Litecoin (LTC) data. Here you can see the strategy in action. During uptrends the strategy finds multiple long entry points generating a series of wins.
Unfortunately, when the indicator triggers a long entry signal and the trend doesn’t continue upwards, often the stop loss is activated and the trades result in a loss.
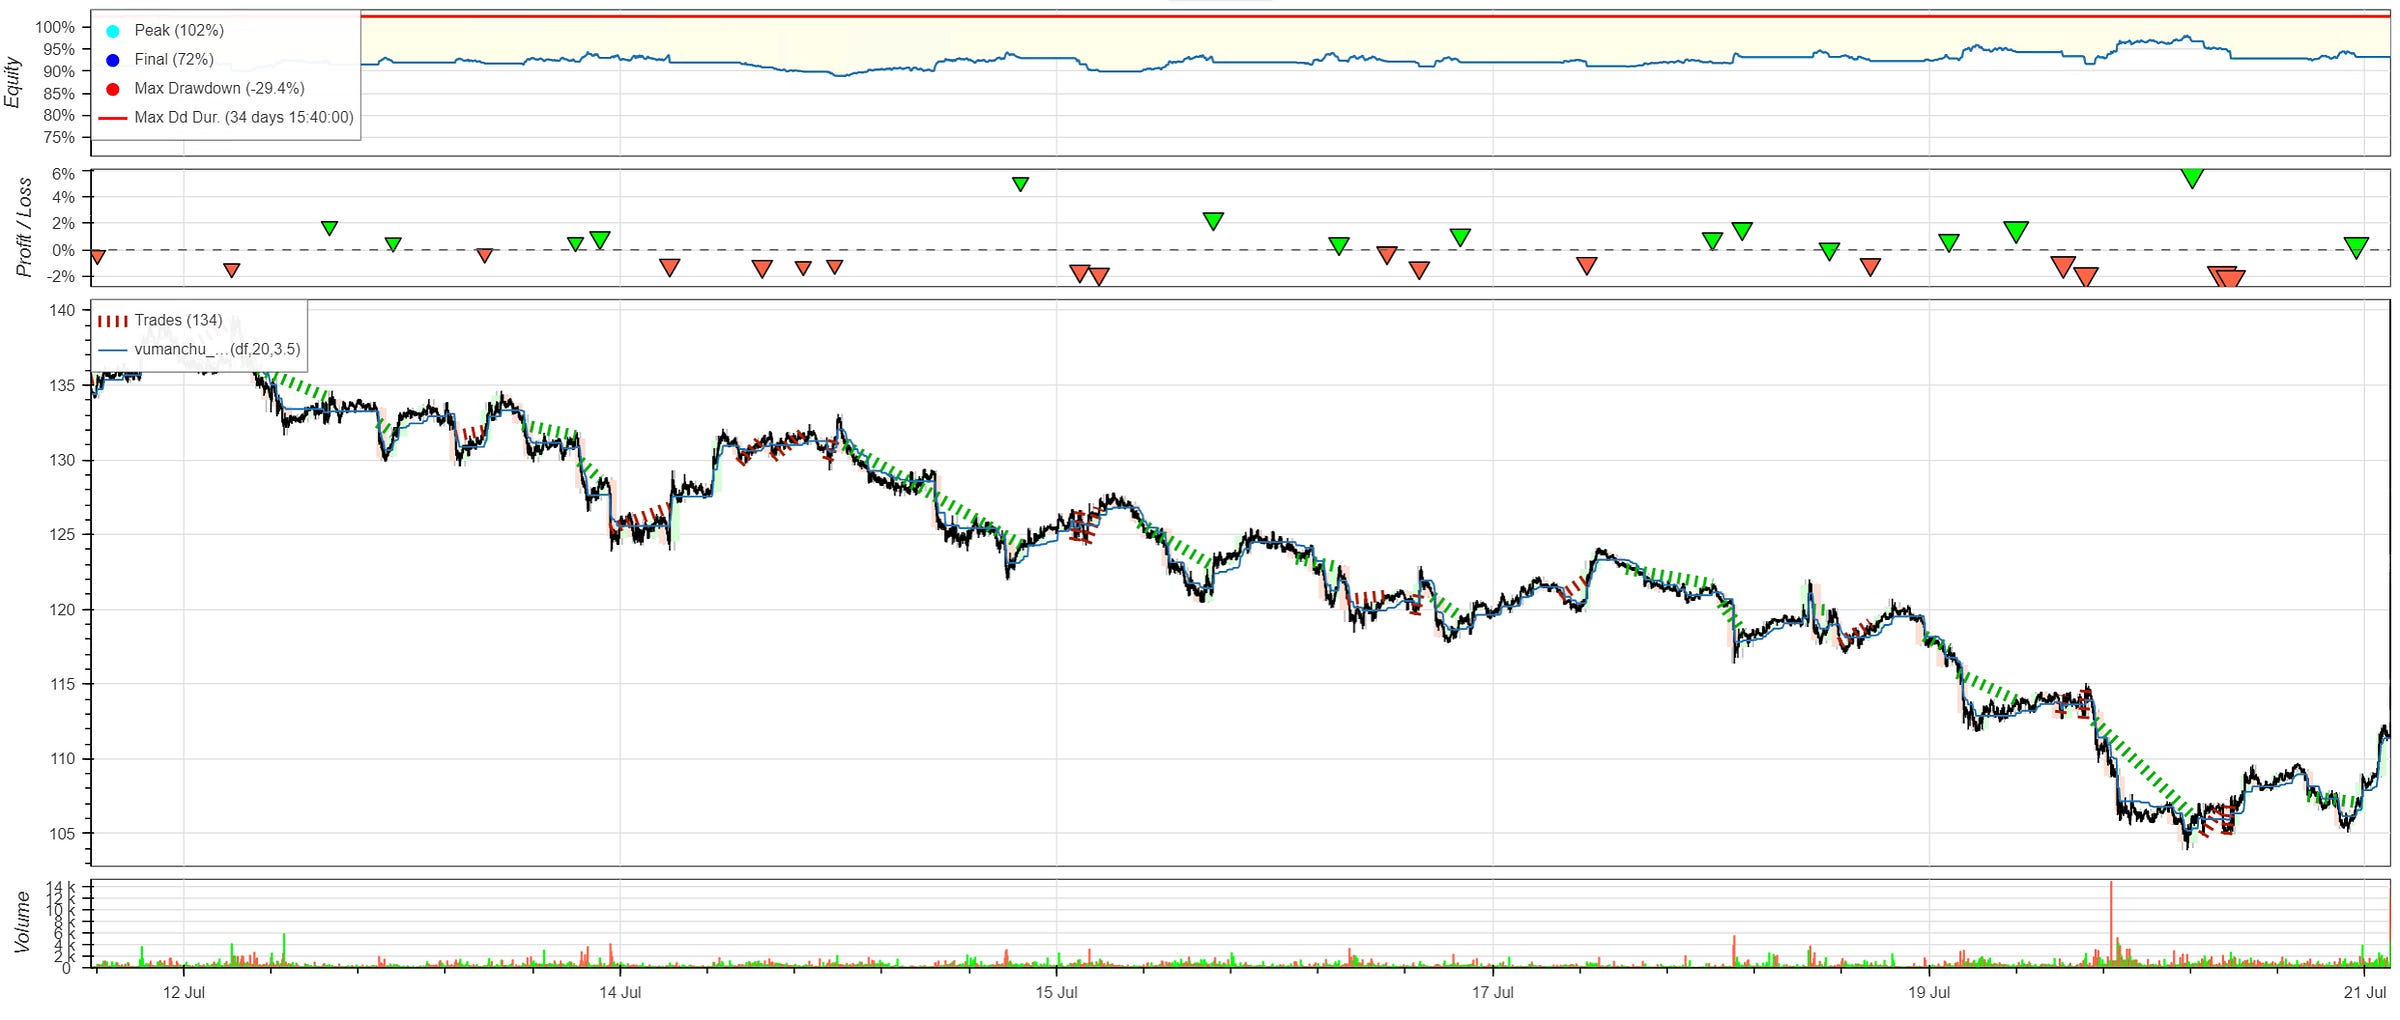
During downward trends we can take advantage of the short position for this strategy as you can see in this chart. Again, the stop loss activates if the short entry signal is triggered but the trend doesn’t continue.
One of the nice features about this strategy is that it takes advantage of the full length of an upward or downward trend as you can see in the first and fourth quarter of the chart.
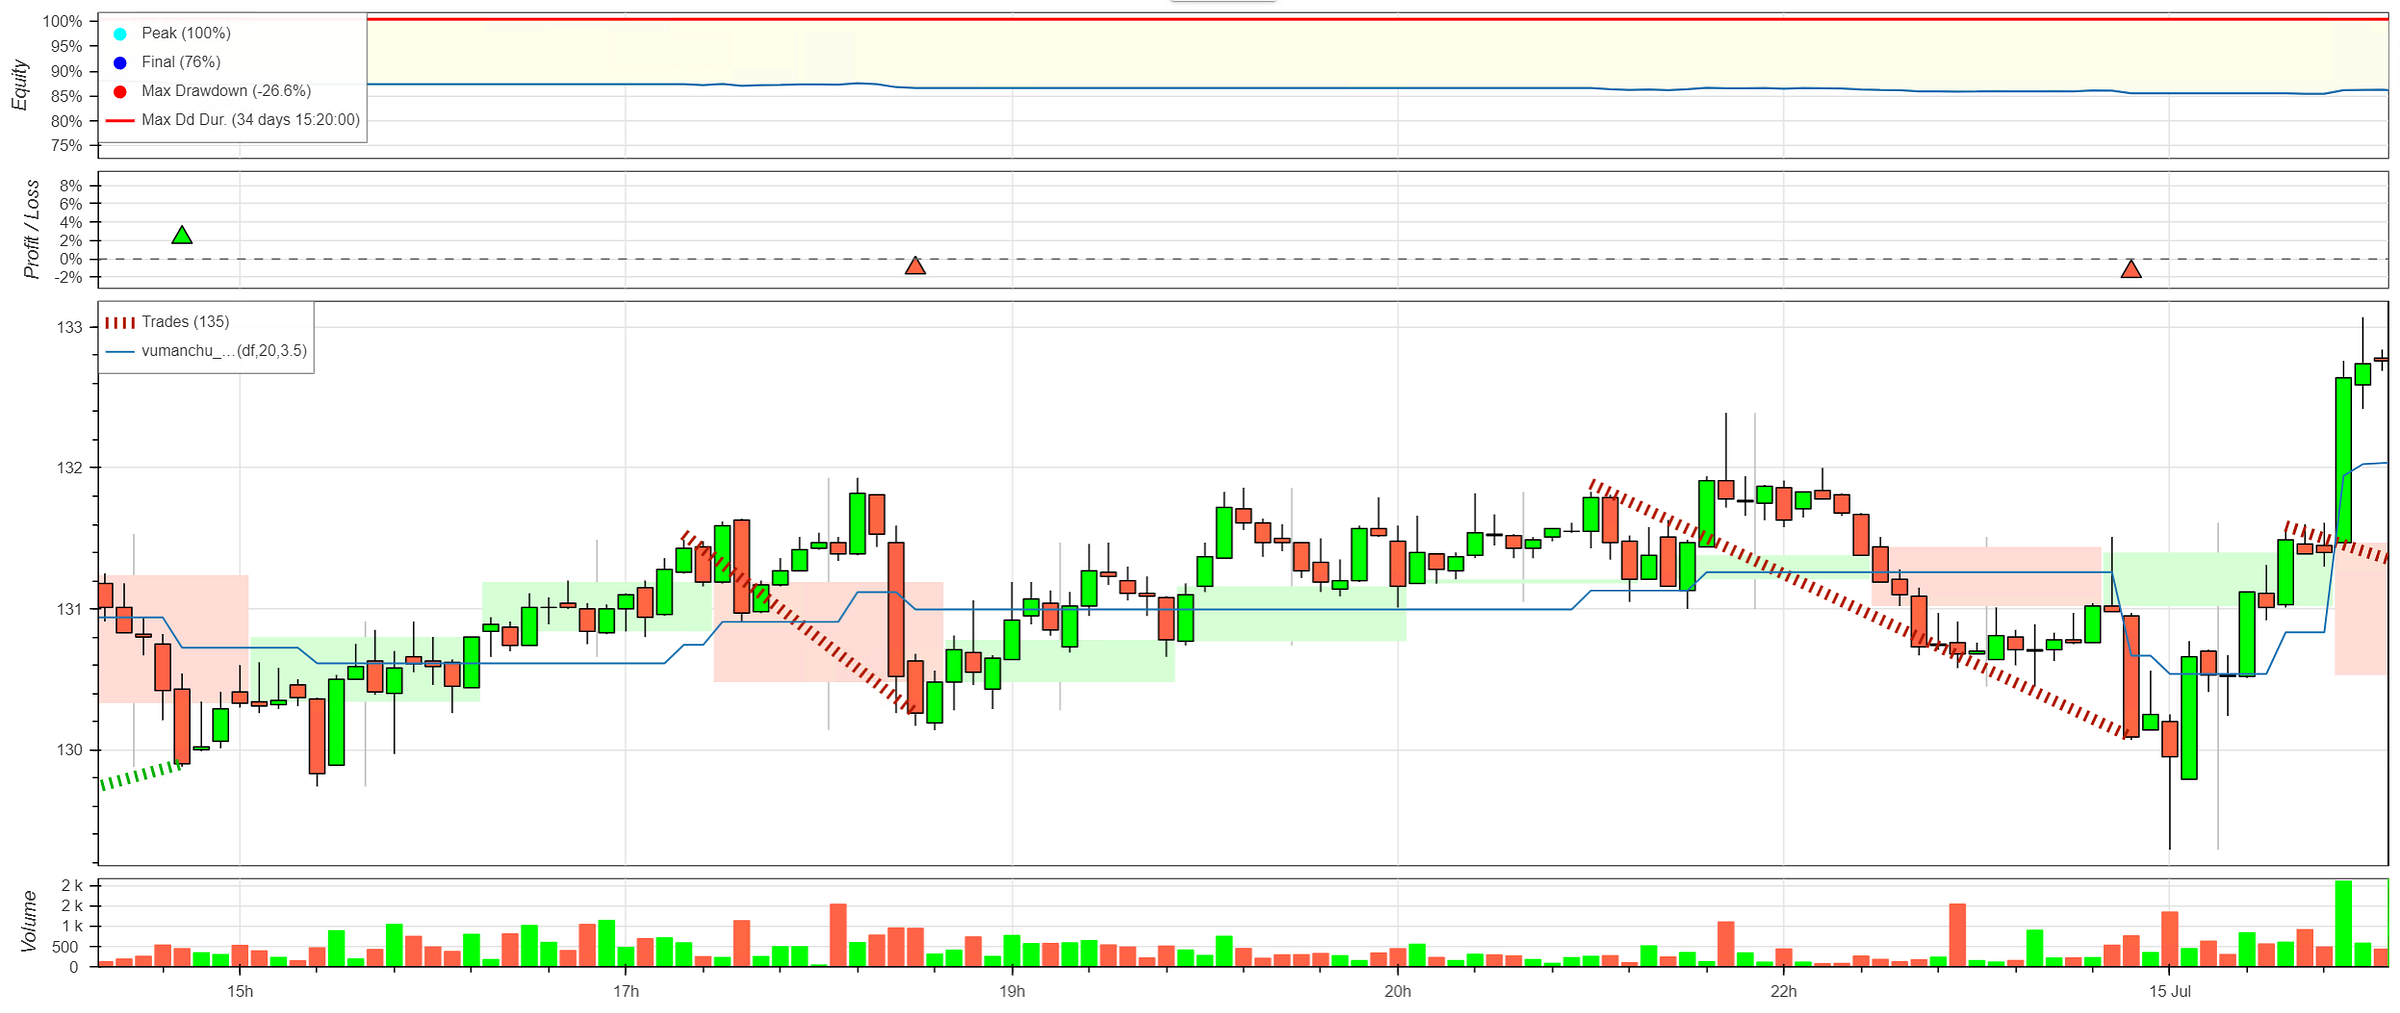
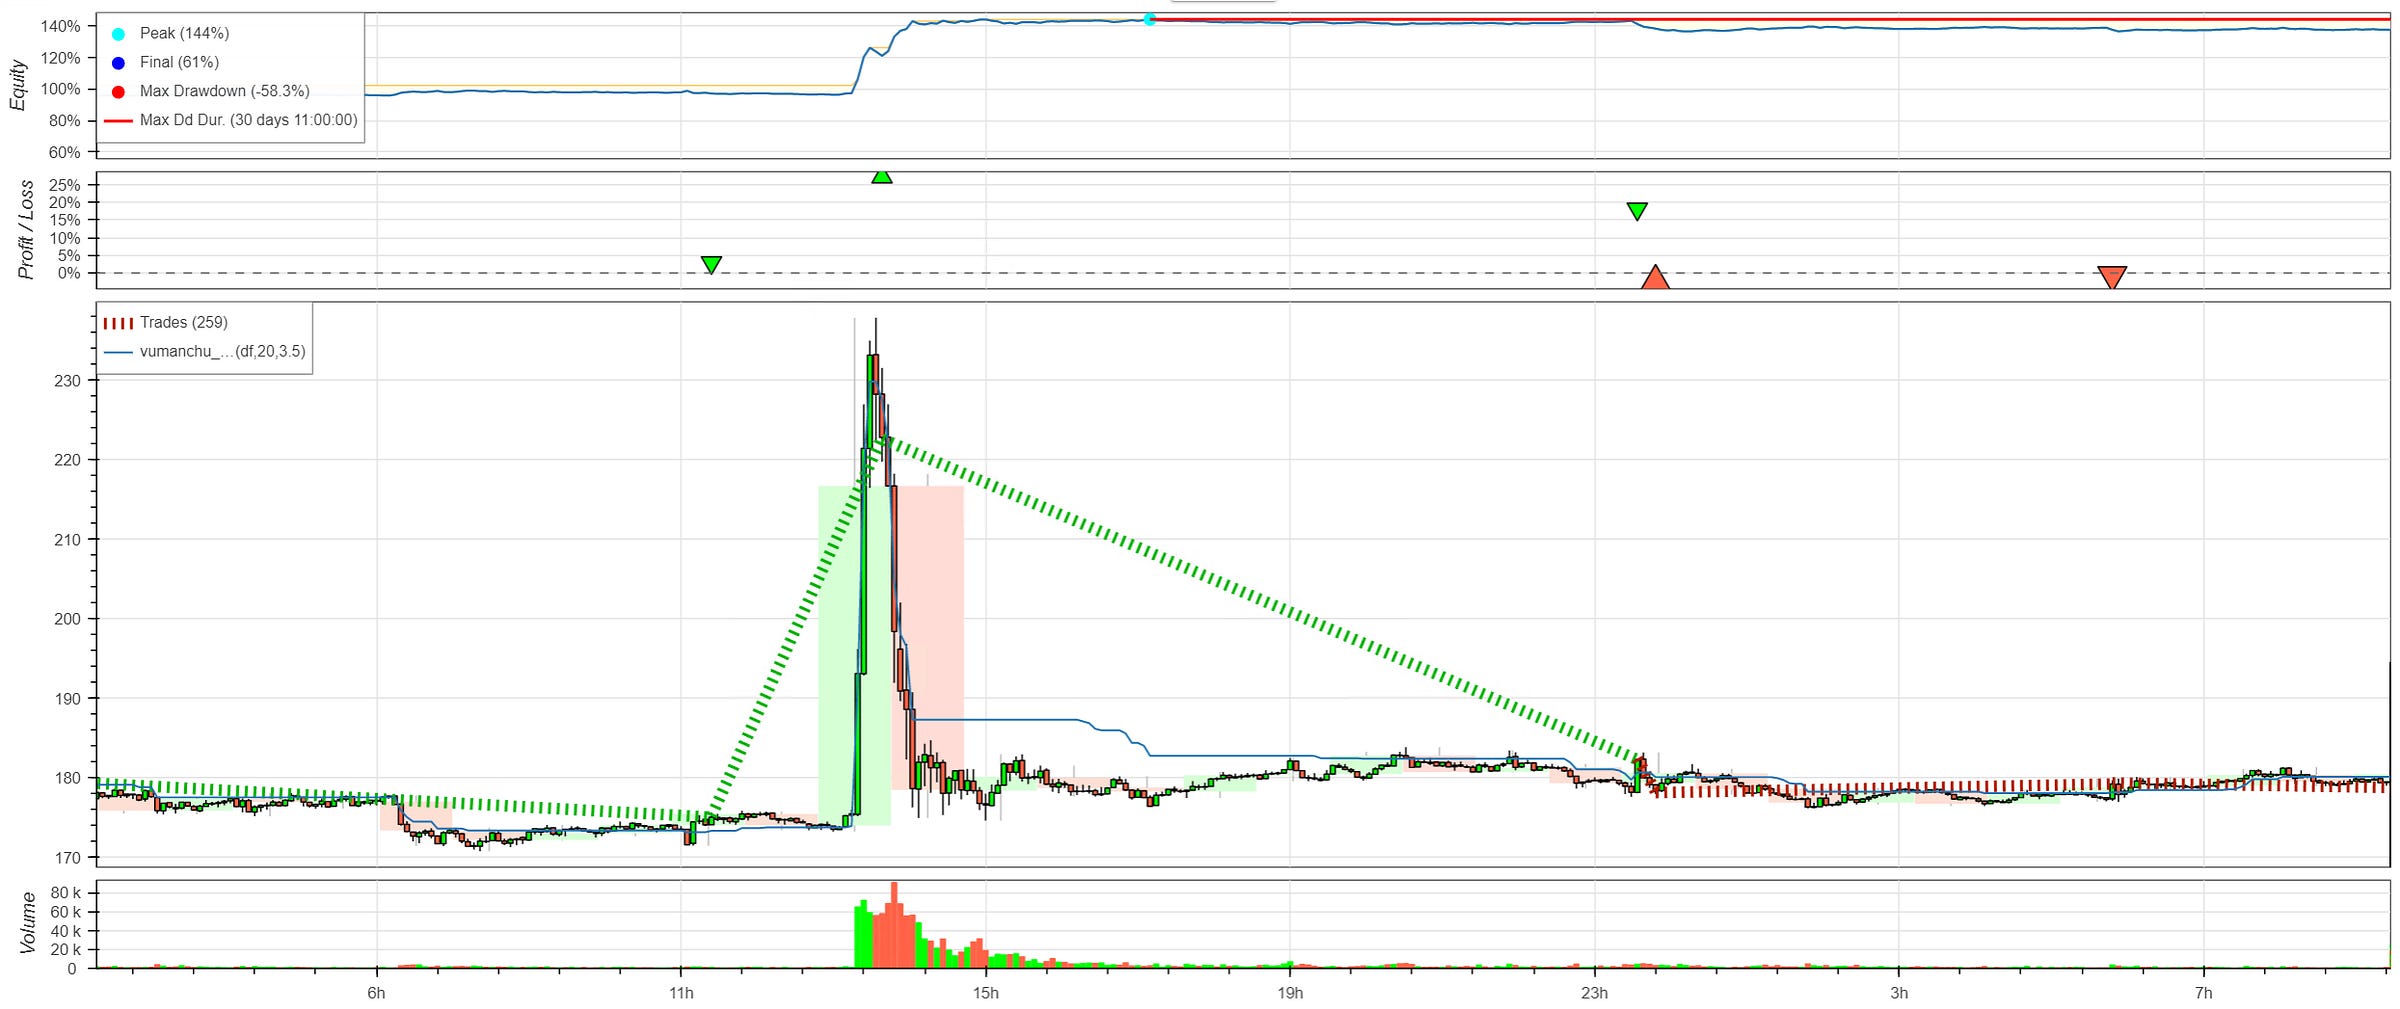
The strategy can even handle volatile price spikes are you can nicely see in the chart below.
Wrapping Up
This post was a tutorial on how to build a trading strategy using the Vuman Chu Swing Indicator and how to implement it in Python using backtesting.py. We also reviewed a few sample results of the strategy.
I hope this post was worth your time. If you enjoyed it, please ‘like’ it.
Have a great day!


Super good post. This next week I plan to put it into practice. is it possible that in a next post you will talk about a Bot that detects Pumps and Dumps? Thank you very much.