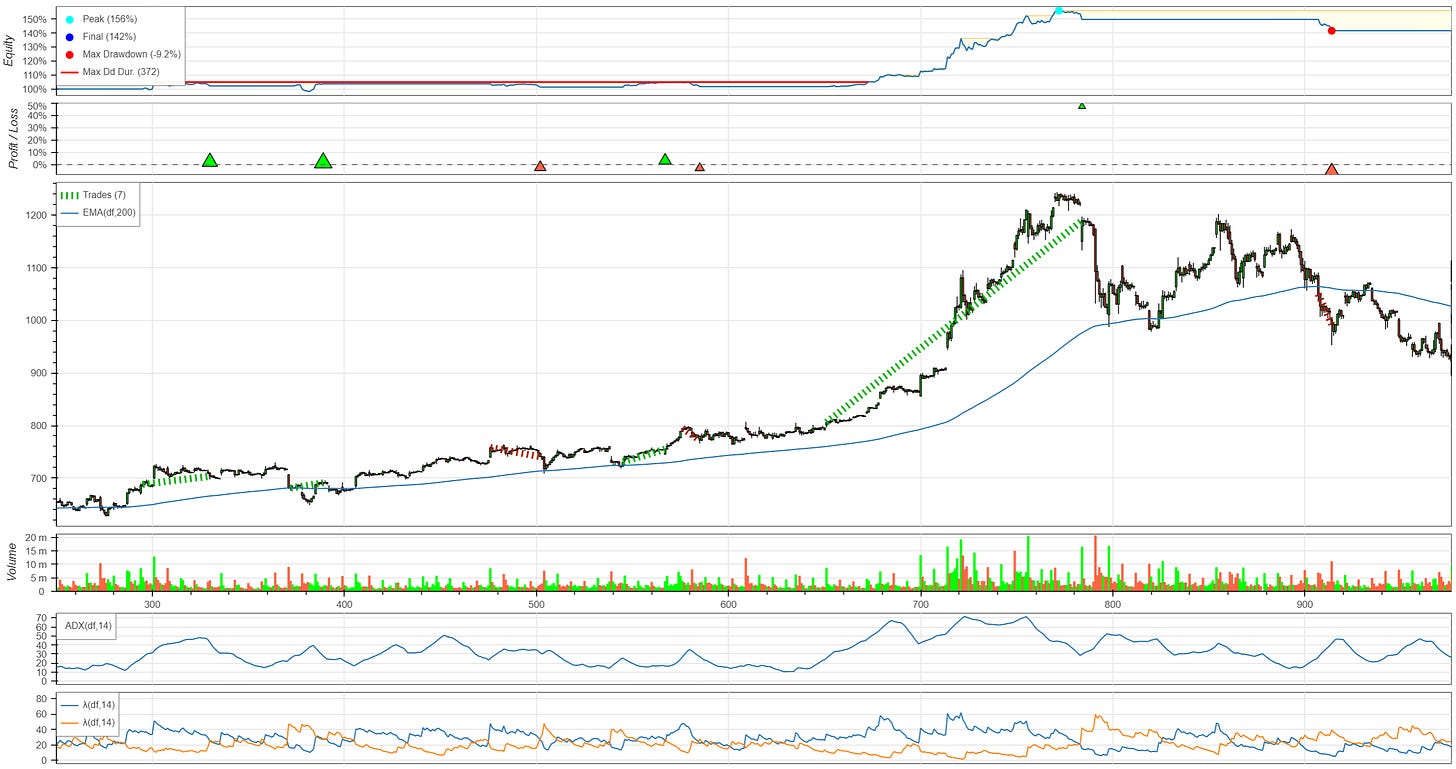
Trading with the Average Directional Movement Index (Python Tutorial)
The Average Directional Movement Index (ADX) is one of my favorite technical indicators because it indicates both the direction and the strength of a trend, two components that come in handy when developing a trading strategy.
In this post I would like to go over how the ADX is calculated and how it can be used as part of a trading strategy. Then we will go over the Python implementation and look at a few results.
This story is solely for general information purposes, and should not be relied upon for trading recommendations or financial advice. Source code and information is provided for educational purposes only, and should not be relied upon to make an investment decision. Please review my full cautionary guidance before continuing.
What is the Average Directional Movement Index?
The Average Directional Movement Index (ADX) is a trend indicator developed by analyst heavy-weight J. Welles Wilder and is based on the analysis of upward movements and downward movements of high and low prices over a period of time. The result of this analysis is then smoothed with the use of moving averages and the Average True Range (ATR). Due to the use of moving averages, the ADX is a lagging indicator.
The ADX actually consists of three separate indices:
The Positive Directional Indicator (+DI), which tracks the upward movement of high prices
The Negative Directional Indicator (-DI), which tracks the upward movement of low prices, and
The Average Directional Movement Index (ADX) combines the two directional indicators to provide information about the strength of a trend.
Trade Ideas provides AI stock suggestions, AI alerts, scanning, automated trading, real-time stock market data, charting, educational resources, and more. Get a 15% discount with promo code ‘BOTRADING15’.
Formula (from Wikipedia):
First, the +DI and -DI are calculated as follows:
Upward and Downward moves are calculated over a period of time - typically 14 days.
Upward Move: Today’s High - Yesterday’s High
Downward Move: Yesterday’s Low - Today’s Low
+DM = 0
if Upward Move > Downward Move and Upward Move > 0:
+DM period value = Upward Move
-DM = 0
if Downward Move > Upward Move and Downward Move > 0:
-DM period value = Downward Move
Next, the +DM and -DM values are smoothed:
+DM = (100 * Smoothed MA(+DM)) / ATR
-DM = (100 * Smoothed MA(-DM)) / ATR
Finally, the ADX indicator is calculated:
ADX = (100 * abs(+DI − -DI)) / (+DI + -DI)


