Using the Random Forest ML Algorithm for Stock Price Prediction (Python Tutorial)
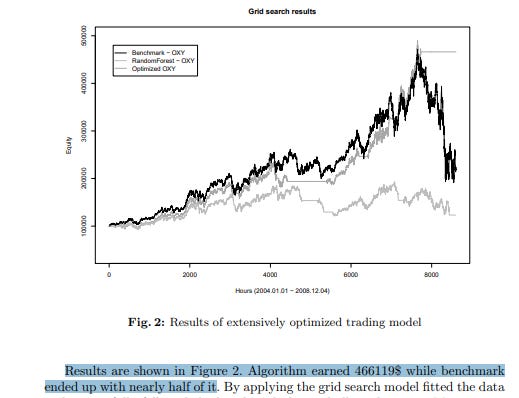
I recently read about a study about using the Random Forest ML for stock price prediction by Ladyzynski, Grzegorzewski and Zbikowski. Somewhere hidden on page 9 is an interesting fact: According to the authors, the optimized Random Forest algorithm they developed earned about twice compared to the benchmark index returns.
Soooo, it seemed like a good time to learn more about Random Forest ML, how to implement the algorithm and it’s application for stock price prediction. That’s what this post is about.
Source: Stock Trading With Random Forests, Trend Detection Tests and Force Index Volume Indicators
This story is solely for general information purposes, and should not be relied upon for trading recommendations or financial advice. Source code and information is provided for educational purposes only, and should not be relied upon to make an investment decision. Please review my full cautionary guidance before continuing.
What is the Random Forest ML Method?
According to Wikipedia, RF is an ensemble learning method for classification, regression and other tasks that operates by constructing a multitude of decision trees at training time.
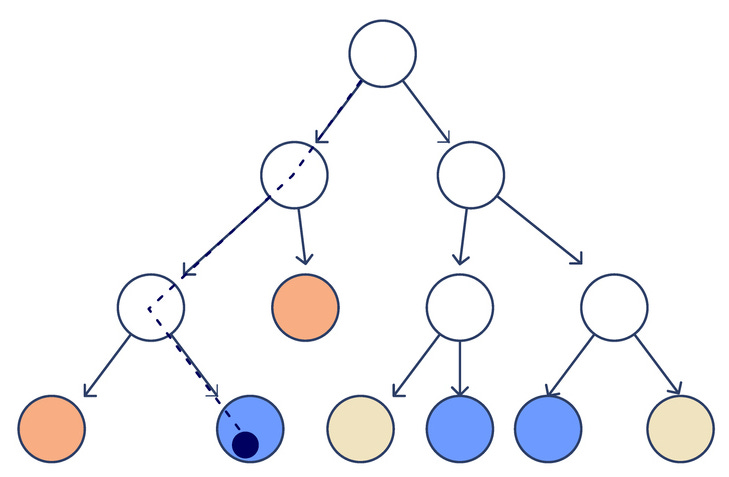
In the context of regression analysis for stock price prediction, a decision tree is a flowchart-like structure in which each internal node represents a test on an attribute (e.g. a stock's trading volume or a technical indicator), each branch represents the outcome of the test, and each leaf node represents a decision (e.g., stock price will rise or fall).
Source: Licensed from iStockPhoto
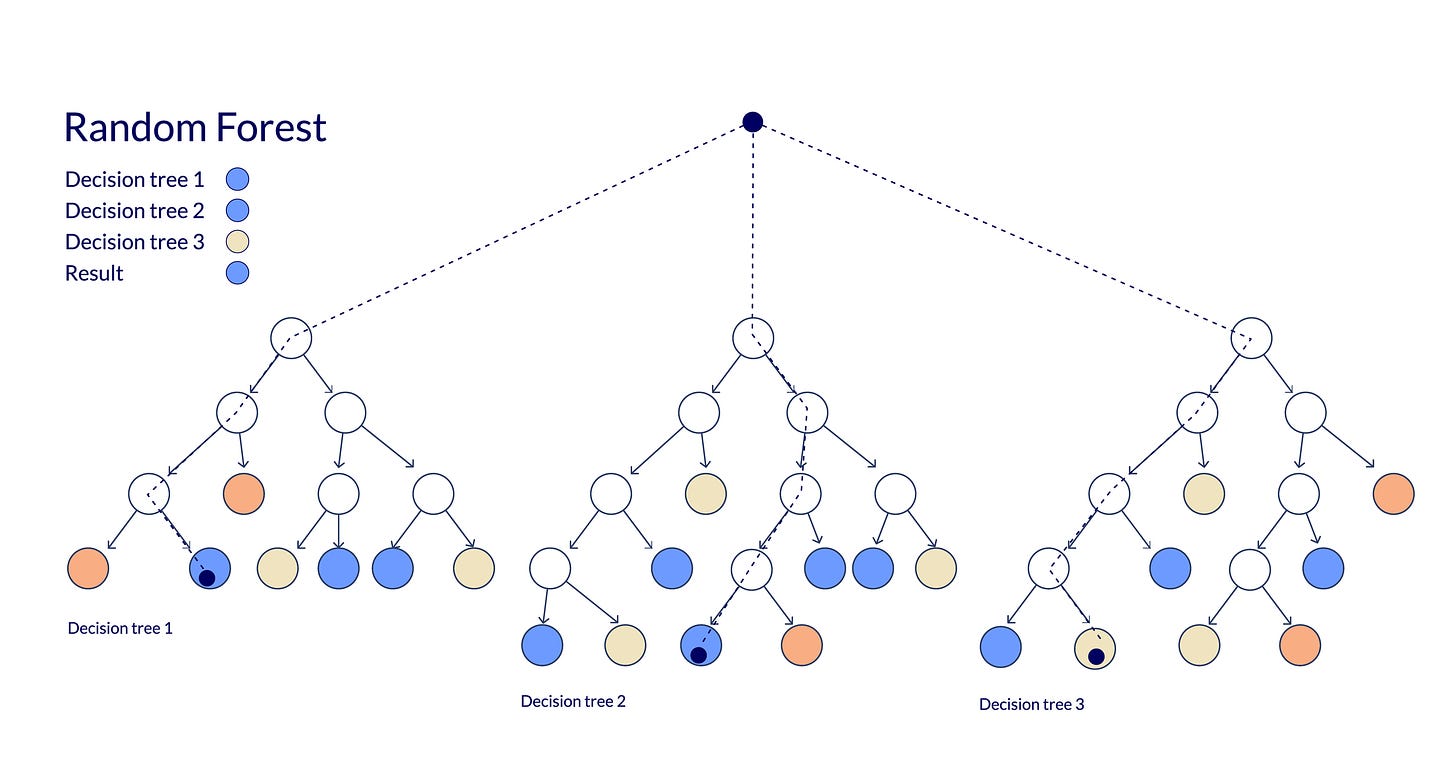
The Random Forest method combines multiple such decision trees in it’s algorithm. The random forest algorithm determines the result using the forecasts from its decision trees. It generations predictions by averaging the likely outputs of multiple trees. Enhancing the number of trees improves the accuracy of the result.
The decision trees are created by selecting a random set of available features (e.g. technical indicators, lags, deltas, candlestick charts, news sentiment) and by applying them to the data to be tested. When making a prediction, a regression Random Forest averages the predictions of all the trees.
In order to make a decision about which prediction to use, the RF method uses a method called ‘classification’ in which a majority vote to chose between the possible outcomes made by the decision trees. This classification algorithm reduces overfitting and variance that is associated when using a single decision tree method.
Source: Licensed from iStockPhoto
Here the main features of the RF Algorithm:
It's more precise than the decision tree algorithm.
It offers a reliable method for managing absent data.
It can generate a dependable prediction without adjusting hyper-parameters.
It addresses the overfitting problem found in decision trees.
A deep dive into what the Random Forest (RF) ML method is would go past the scope of this post. However, here a couple of links for further reading:
Tutorials:
Feature Selection
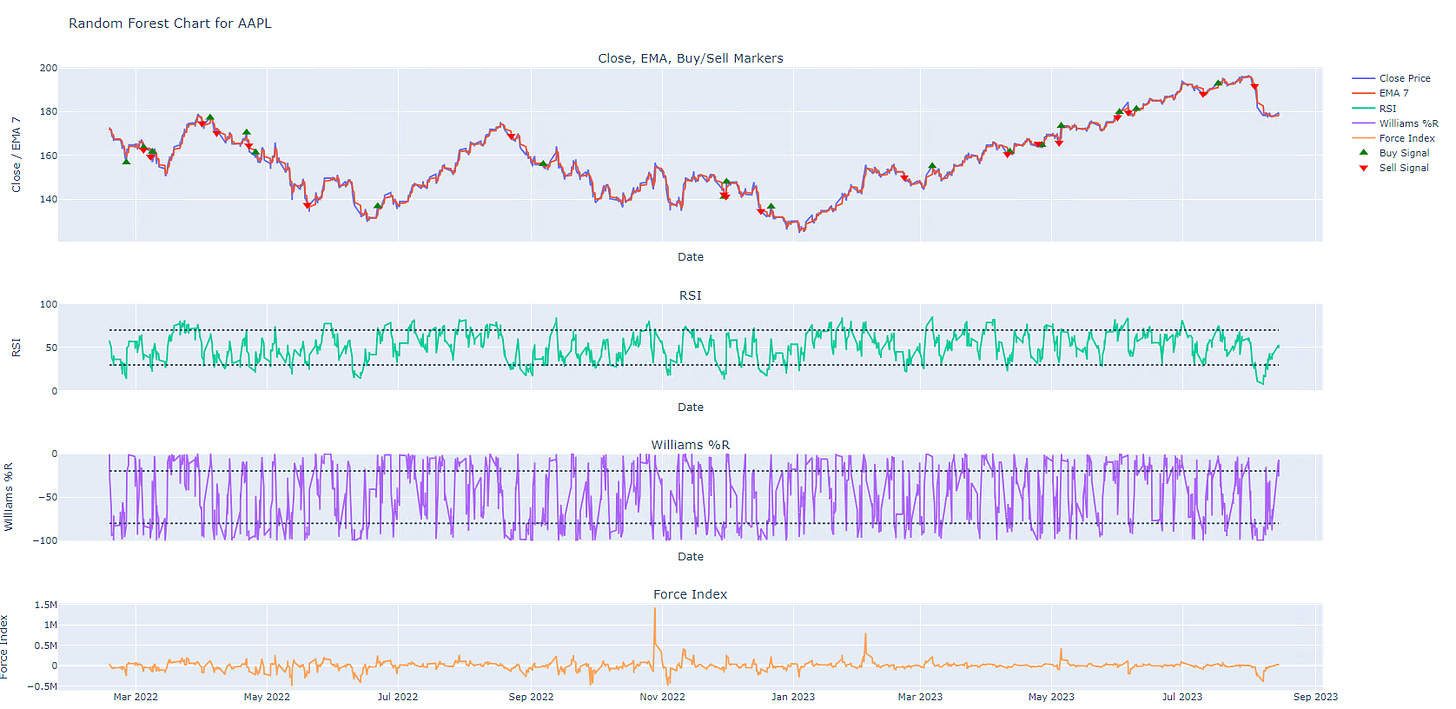
As features I decided to use some of the same features mentioned in the RF study. For the trend indicator the study uses a custom trend formula. For the sake of simplicity, we will use the EMA instead.
Here the list of features:
Trend detection: EMA 7
Oscillators: RSI, Williams Indicator
Volume indicator: Force Index.
The Strategy
In this post we will implement a similar strategy to that mentioned in the RF study. For the data interval we will use the hourly interval.
Long Entry
Buy when the low prediction crosses the low threshold.
Long Exit
Sell when the high prediction crosses the high threshold.
The Game Plan
Fetch hourly price data from Tiingo API
Calculate all technical indicators
Create features (X) and high/low targets (y_low/y_high)
Split the data into training and test data
Train the Random Forest Model with the training
Run a Random Forest strategy with test data
Measure accuracy for training and test data by calculating the Mean Absolute Error (MAE)
Calculate strategy returns
Calculate Buy & Hold returns
Plot results in a chart.
Sounds exiting? All right, then let’s dive right in.
StockDads.com is a thriving trading community with AI trading stock/crypto alerts, expert advice and a ton of educational materials. Get a 30% forever discount with code ‘BOTRADING’


