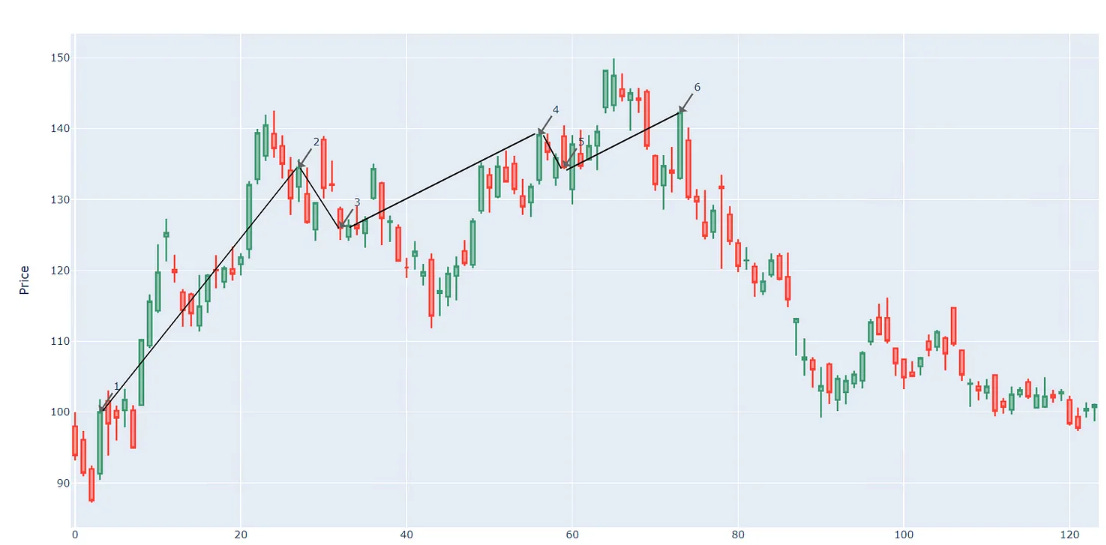
Visualizing Elliott Waves (Python Tutorial)
Elliott Waves have always been a mysterious market phenomenon that have fascinated me so I decided to write an introductory post about how to visualize them in Python. If you would like to find out what Elliott Waves are and how to calculate and visualize them, this post is for you.
This story is solely for general information purposes, and should not be relied upon for trading recommendations or financial advice. Source code has not been tested and should not be used for live trading. Please review my full cautionary guidance before continuing.
What are Elliott Waves?
Elliott Waves are a technical analysis tool used in trading that identifies patterns in financial markets, based on the belief that market trends move in predictable, repeating patterns.
Elliott Waves were developed by Ralph Nelson Elliott, a market analyst in the 1930’s, whose ‘Wave Theory’ gained public interest when he accurately predicted the end of a 13-month market correction in 1935.
The main idea behind the Elliott Wave theory is that financial markets move in predictable, repeating patterns, and these patterns can be used to identify potential trading opportunities.
The theory is based on Elliott’s observation that markets do not move in a straight line but rather in waves, and these waves can be broken down into smaller waves. A major insight of Elliott was this fractal nature of the market. Fractals are mathematical structures, which on an ever-smaller scale infinitely repeat themselves.
A cycle of Elliott Waves consists of five waves in an upward trend, known as ‘Impulse Waves’ and three waves in a downward trend, known as ‘Corrective Waves’.
As you can see in the graph above, the Impulse Waves are labeled with numbers 1 to 5. Of the Impulse Waves, the segments 1, 3 and 5 are upward trending waves and 2 and 4 are downward trending waves as a result of a pullback from the trend.
The Corrective Waves are labeled with letters A to C. Of these waves, A and C are downward trending and B is upward trending.
In order for a wave sequence to be Elliott Waves, they have to match a certain set of rules because not all waves are considered Elliott Waves.
Wave 2 cannot retrace more than 100% of wave one
Wave 3 can never be the shortest of waves one, three, and five
Wave 4 cannot overlap wave one.
And there is much more to learn about Elliott Waves but for the purpose of this tutorial, it should be sufficient. If you’d like to explore more about the topic, here a few helpful links:
What is the taew library?
If you have read a few of my posts you know that I’m not a big fan of writing everything from scratch. First, it makes posts very lengthy, is not particularly practical or exciting and then - why reinvent the wheel?
To analyze Elliott Wave patterns I found the taew library developed by Edward Wong, which seems to do the trick.
If you look at the documentation, the package has functions for identifying all waves (Alternative_ElliottWave_label_upward), for identifying waves 3 and 5 (Practical_ElliottWave3_label_upward, Practical_ElliottWave5_label_upward) and for performing Fibonacci checks on all waves (wave<x>_fibonacci_check).
In this tutorial we will use the Alternative_ElliottWave_label_upward() function to identify Elliott Wave candidates and get the starting index of each wave so we can visualize them in a chart.
Are you ready to write some code? Then let’s get started.
StockDads.com is a thriving trading community with AI trading stock/crypto alerts, expert advice and a ton of educational materials. Get a 30% forever discount with code ‘BOTRADING’.


